Blog
States Say No, Counties Say Yes: Mapping America’s Hidden Data Center Opportunities

Read More

KEY TAKEAWAY
Opposition to local data centers is not a wall. Half of Americans say they don’t want one in their community, but two-thirds of them name at least one commitment that would move them toward yes. Nearly half of opposed U.S. counties, home to 145 million people, are just one commitment away from solid majority support, almost always a guarantee that residents’ utility bills won’t go up.
Half of Americans say they don’t want a data center built in their local community or county. That was the headline of our last piece, along with the surprise underneath it: about one in six U.S. counties actually welcome one. This piece asks the obvious next question.
For the other 2,576 counties, can local residents and hyperscalers get to yes? If so, what would it take?
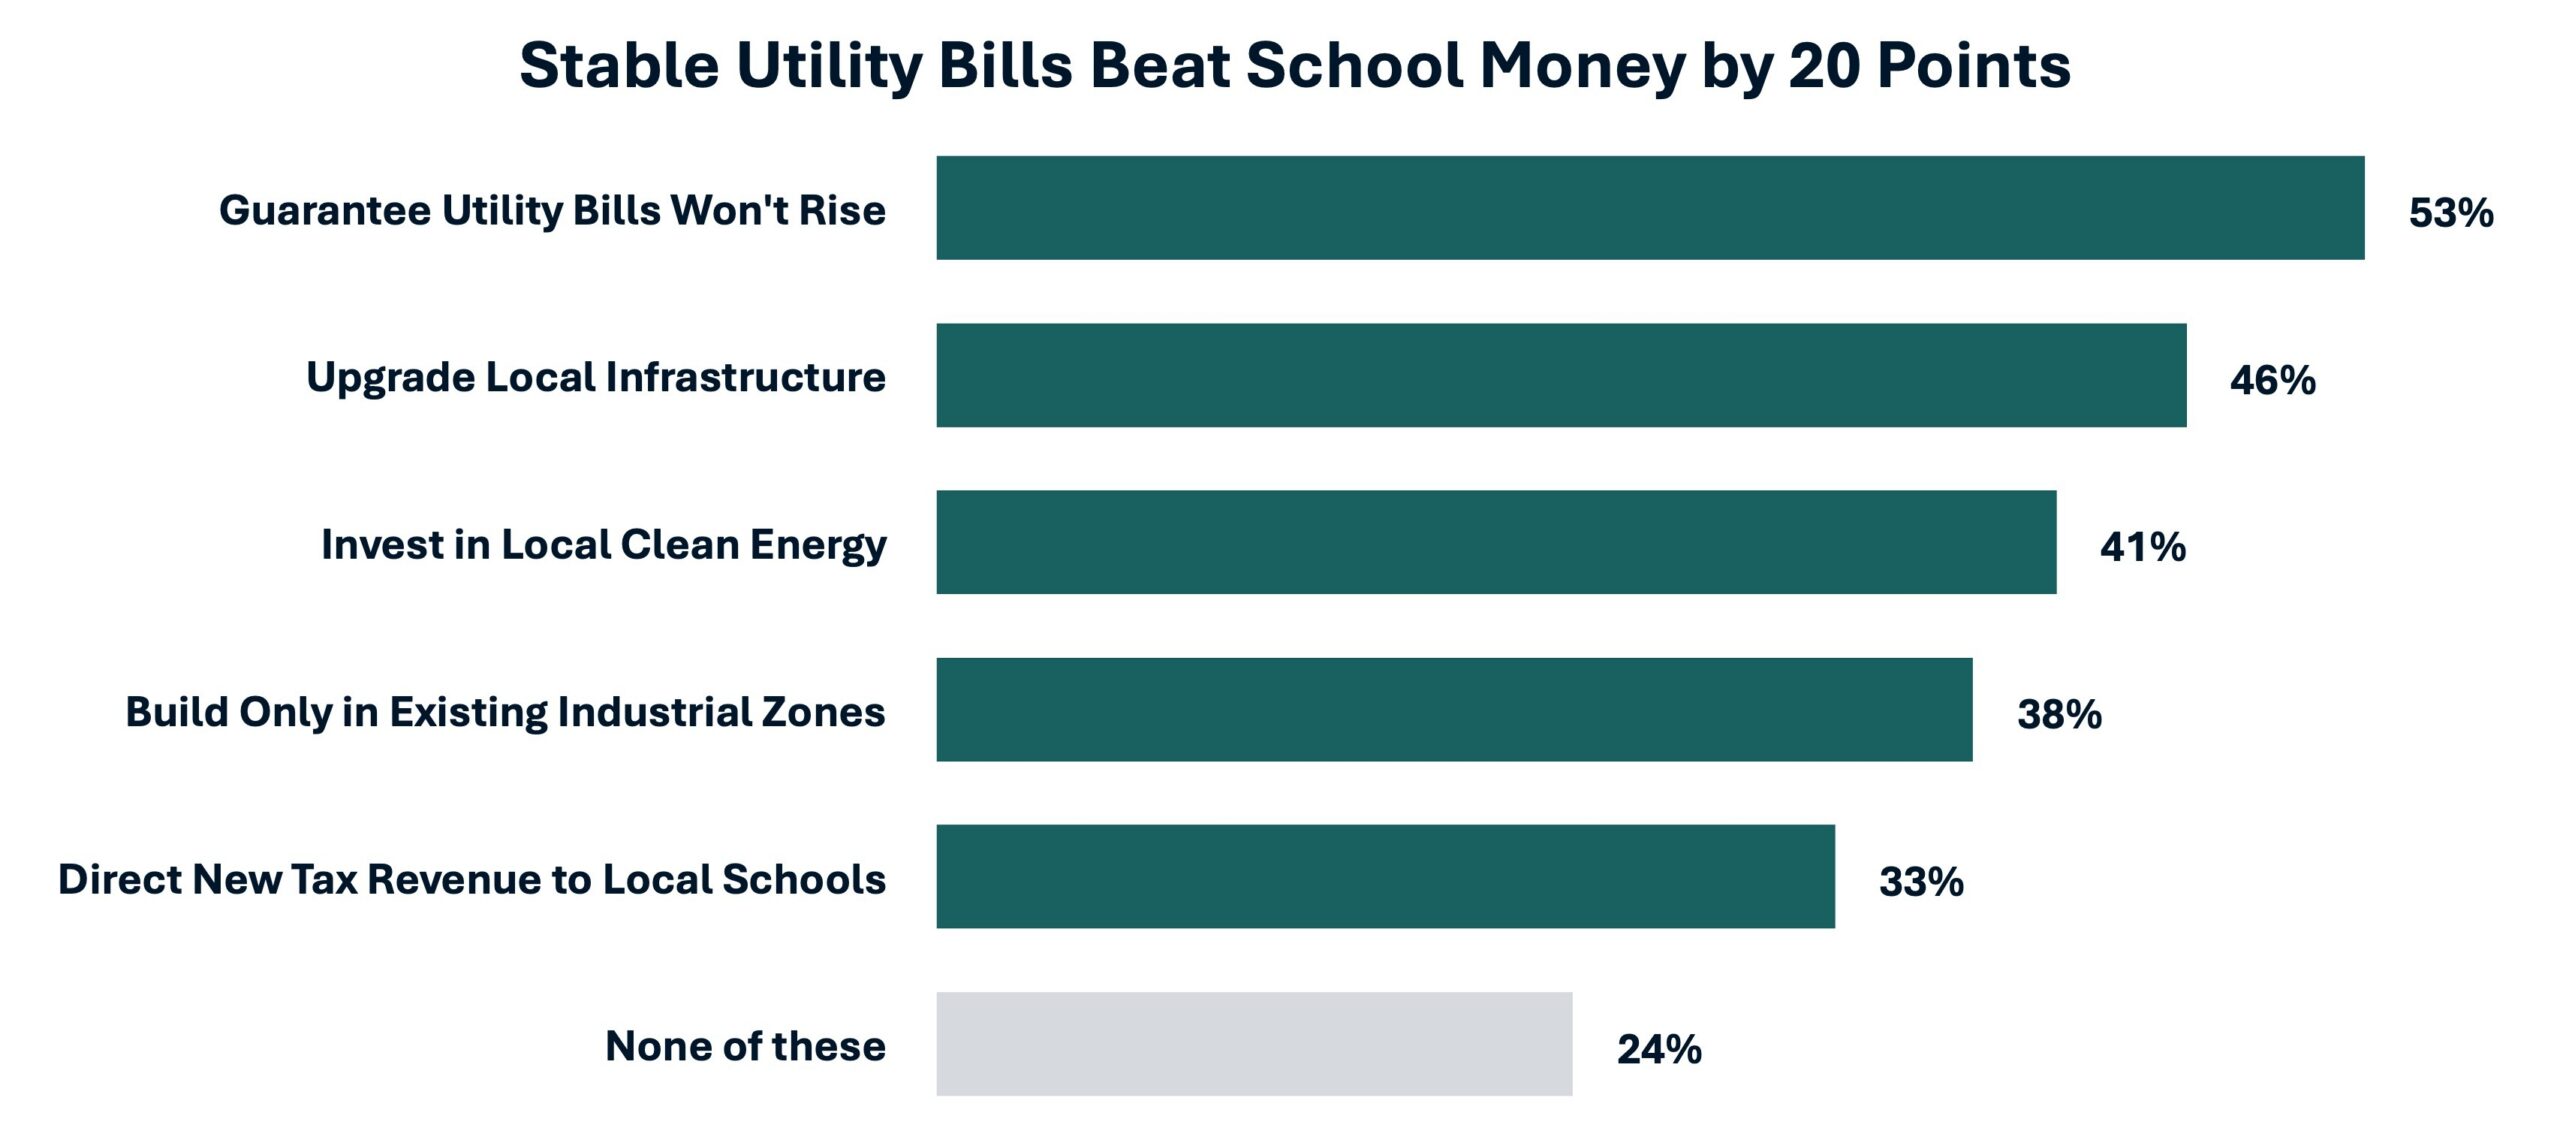
We asked what commitments, if any, would make people more supportive of a local data center. The answers came back clear — and clearly ranked. At the top, guaranteeing that utility bills won’t rise (53%). At the bottom, directing new tax revenue to local schools (33%). A 20-point gap between what communities value most and least.
Communities aren’t asking for gifts. They’re asking for protection from specific harms and investment in specific needs.
Source: Fraym data (July 2026) and analysis
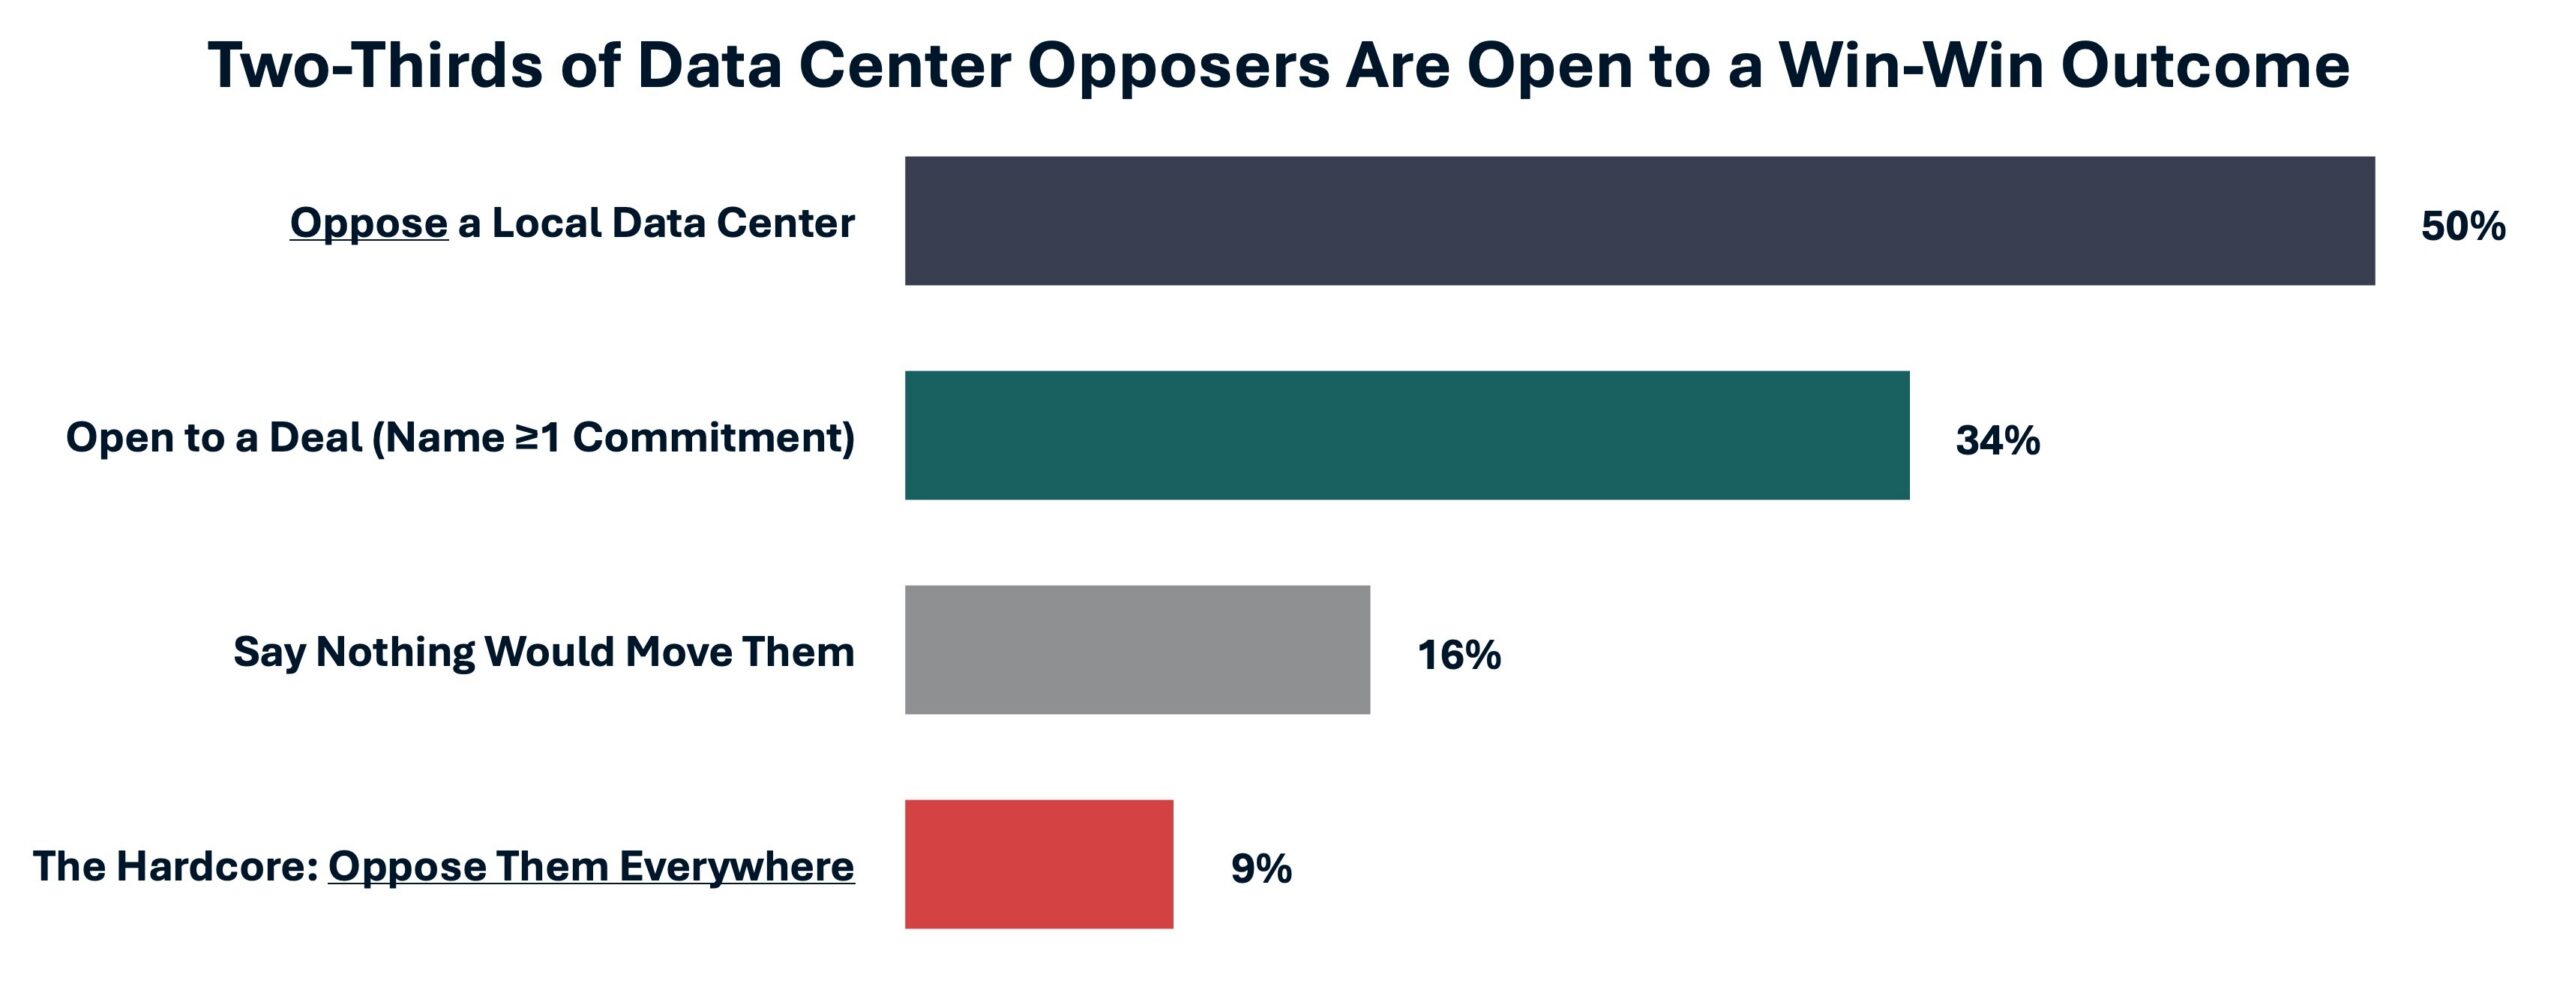
Opposition to data centers may look like a wall, but it clearly isn’t. Among the half of Americans who oppose a local data center, two-thirds name at least one commitment that would move them toward yes. Put differently: 34% of all American adults are opposed but open to a negotiated win-win outcome.
Only 16% of adults oppose and say nothing would move them. And the super hardcore opposers – those who say nothing would move them and believe data centers shouldn’t be allowed anywhere – are just 9%. One American in eleven, not one in two.
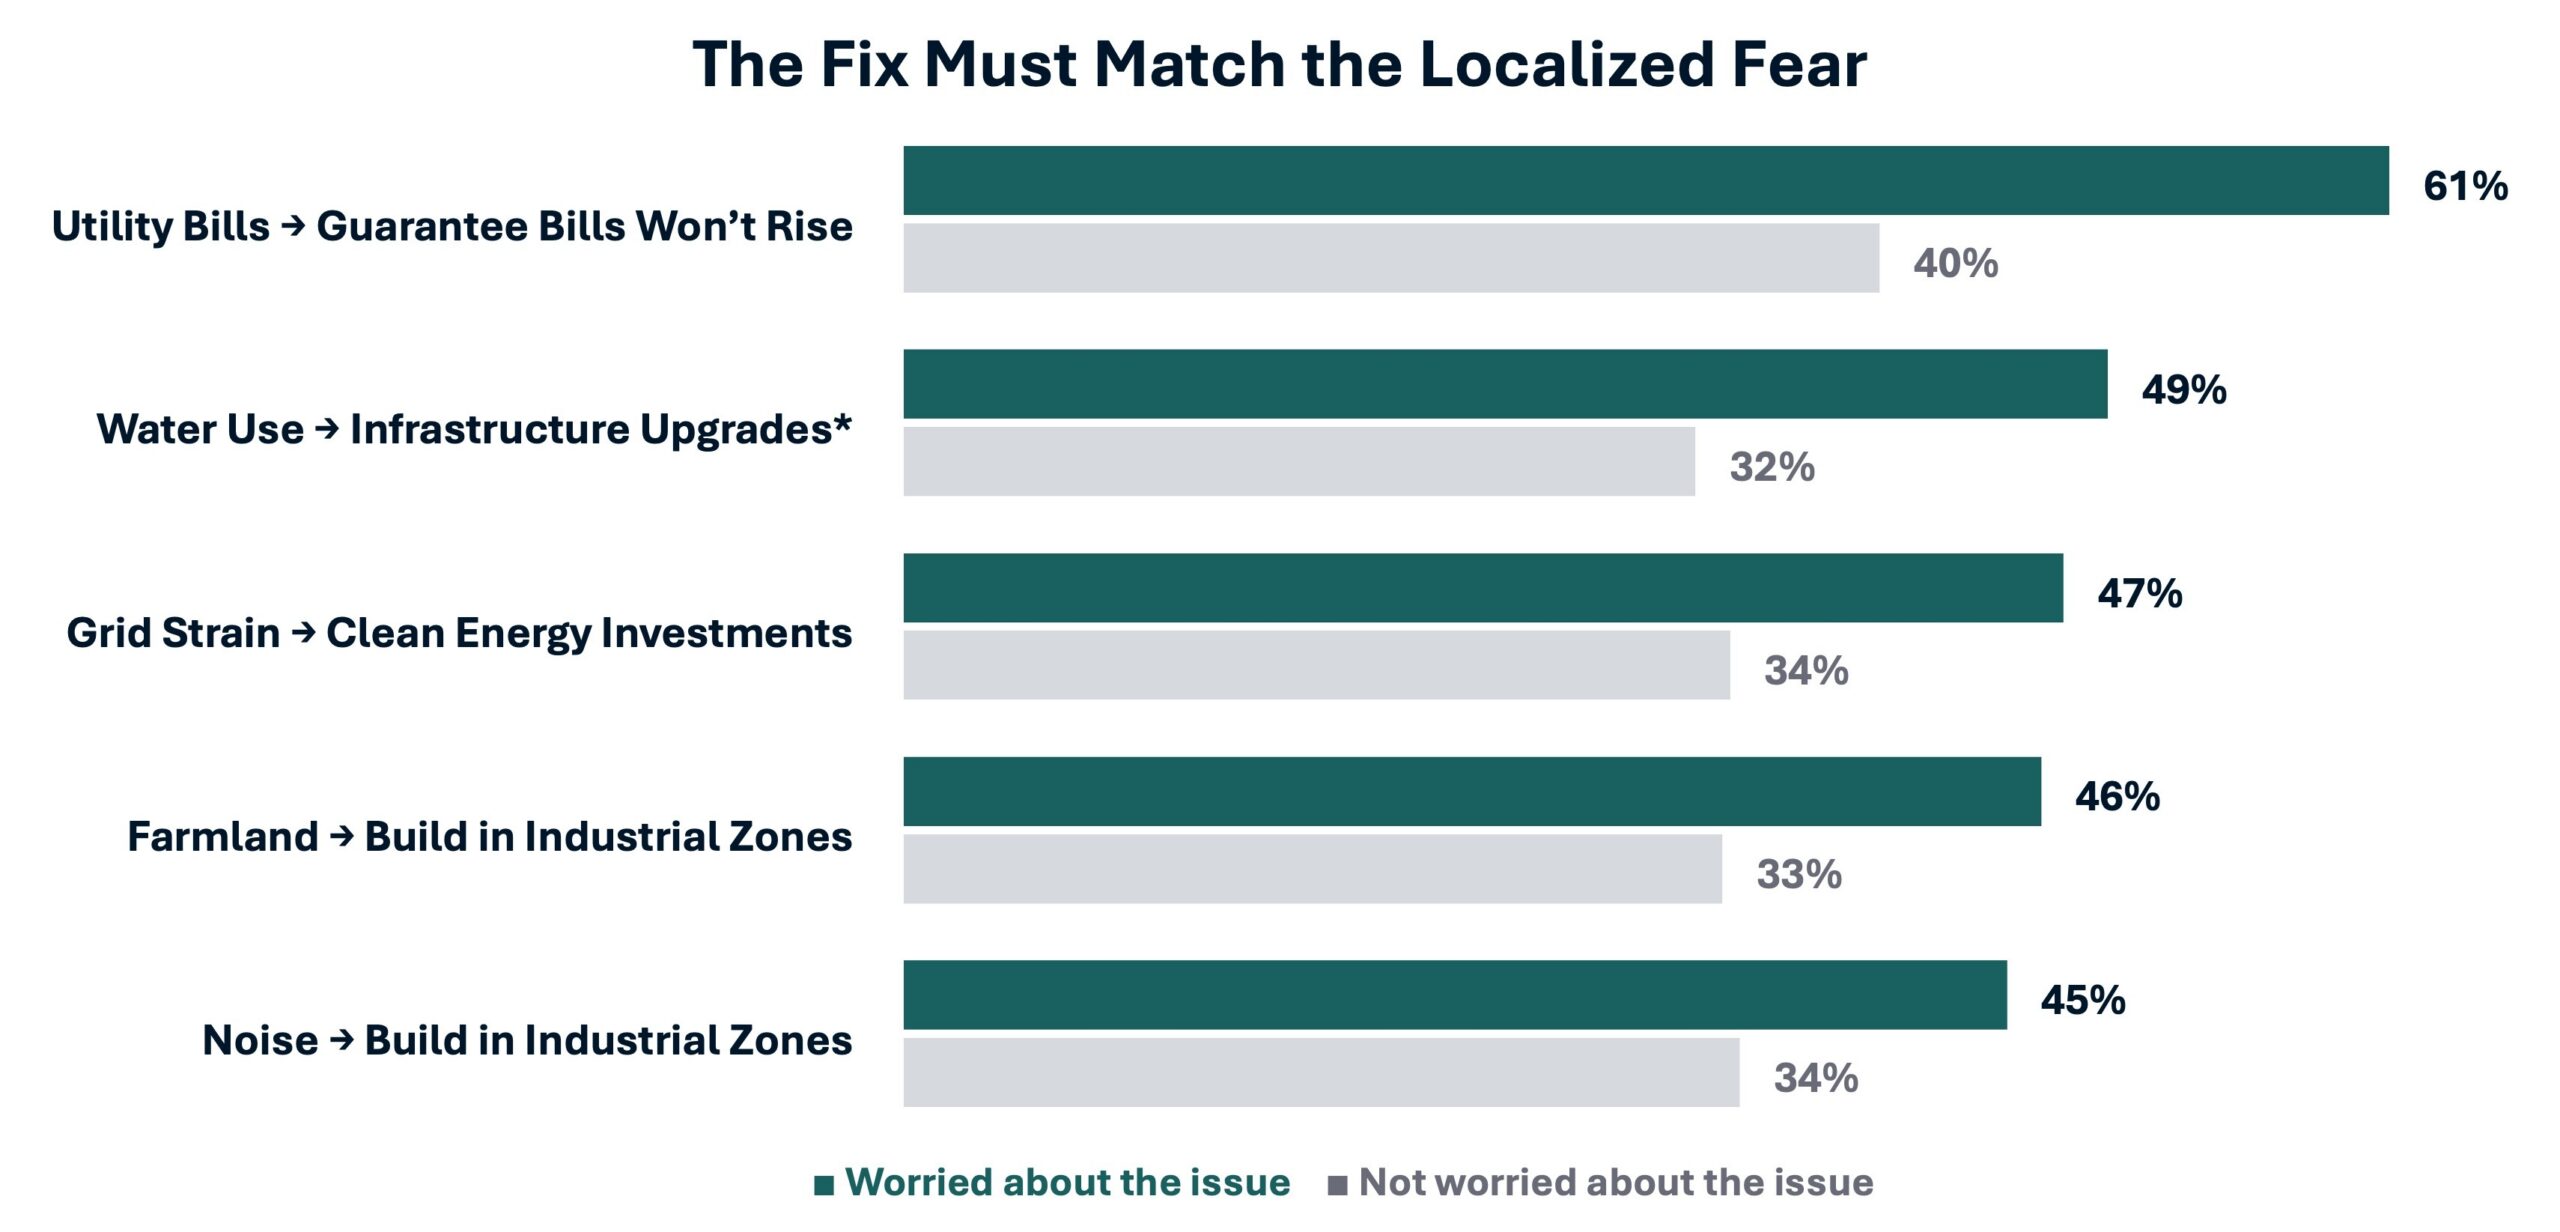
However, the offer must match local concerns. People respond to commitments that address their specific worry, not generic goodwill. Among Americans worried about higher utility bills, 61% say a bill guarantee would move them, versus just 40% of those who aren’t concerned about their utility bill. The same pattern holds across every fear we tested, by 11 to 21 points.
Since worries differ from place to place, the right package differs from place to place too…
We took every net-negative county in America and asked how many of the five commitments it would take to reach solid majority support. The kind of durable local buy-in a multibillion-dollar, long-term facility needs. We were deliberately conservative. We assumed only soft opponents could be moved (i.e., people somewhat opposed who don’t rule out data centers everywhere), and that the most ardent opponents would remain hardcore under all scenarios.
It turns out that nearly half of opposed counties, which are home to 145 million people, are only one commitment away from solid majority support. It’s almost always the same commitment: guarantee that residents’ utility bills won’t go up. Another quarter need a package of two commitments, most often the utility bill guarantee plus local infrastructure investment.
All told, roughly seven in ten opposed counties are reachable with two commitments or fewer.
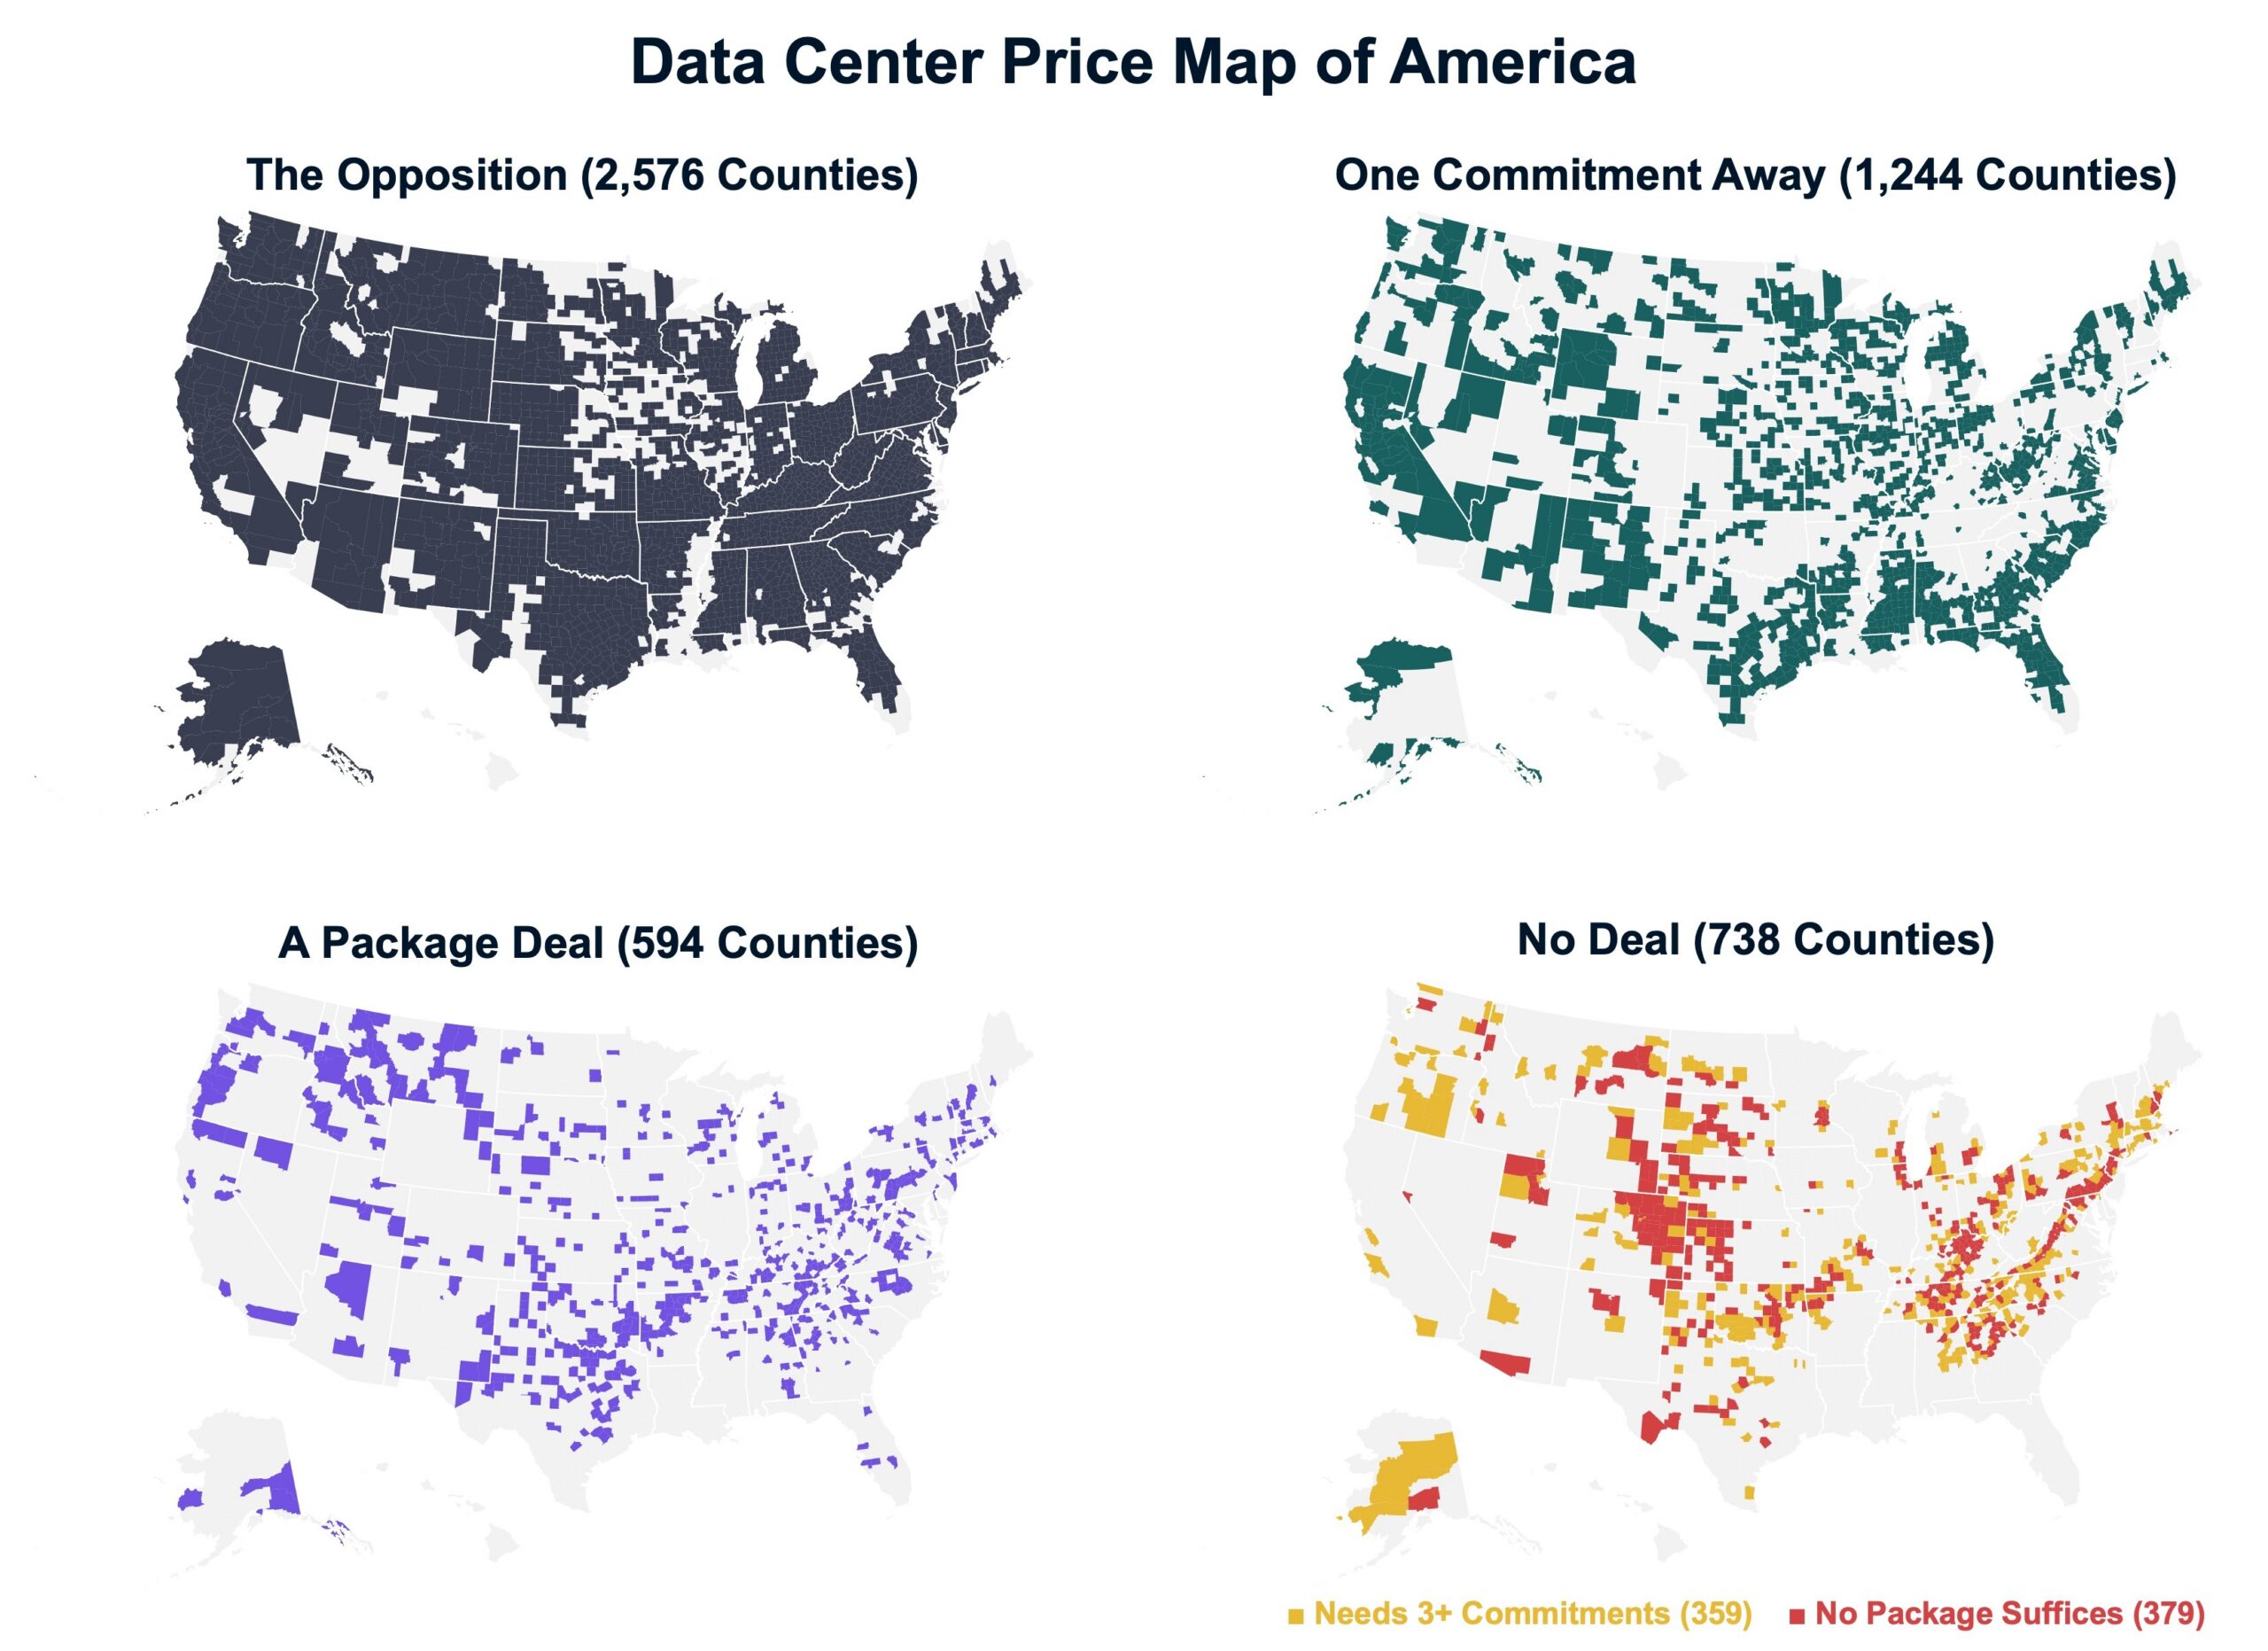
In 379 counties — led by Kentucky, Georgia, Tennessee, Kansas, and Colorado — no combination of the five commitments gets to solid majority support. Too much of the local opposition simply isn’t open to a win-win deal. Those local communities have spoken, and the answer is simple – build somewhere else.
The national conversation treats data center opposition as a wall. It’s not. It’s a map of what communities need to see before they can say yes. Nearly half of opposed America is one commitment away. Another quarter needs two. The remainder aren’t reachable at any realistic price. For companies planning to be someone’s neighbor for years and years, that map is the difference between guessing and listening — and what residents want is no longer a mystery. County by county, commitment by commitment, the data exists now.
Interested in tracking trends like these down to the census tract level across the U.S.? Contact Melissa Persaud at [email protected].
Leo, B. (2026). The Price of Getting to Yes on Local Data Centers. Arlington, VA: Fraym.
For questions or additional information, please contact:
Ben Leo
Executive Vice Chairman & Co-Founder
Email: [email protected]
Figures, charts, and maps in this post are drawn from Fraym data (July 2026) and analysis. Solid majority support is defined as net +10 support in a county. The county analysis is deliberately conservative: only soft opponents (people somewhat opposed who don’t rule out data centers everywhere) are assumed to be movable, and the most ardent opponents are assumed to remain opposed under all scenarios.
About half. Half of Americans say they don’t want a data center built in their local community or county. But the opposition is softer than it looks: two-thirds of those who oppose one name at least one commitment that would move them toward yes.
Guaranteeing that utility bills won’t rise ranks first, at 53%. Upgrading local infrastructure follows at 46%, then investing in local clean energy (41%), building only in existing industrial zones (38%), and directing new tax revenue to local schools (33%), a 20-point gap between what communities value most and least. 24% chose none of these.
34% of all American adults. Only 16% oppose a local data center and say nothing would move them, and just 9% are hardcore opposers who also believe data centers shouldn’t be allowed anywhere.
People respond to commitments that address their specific worry, not generic goodwill. Among Americans worried about higher utility bills, 61% say a bill guarantee would move them, versus 40% of those who aren’t concerned about their utility bill. The same pattern holds across every fear tested, by 11 to 21 points.
Nearly half of opposed counties, which are home to 145 million people, are one commitment away from solid majority support. It’s almost always the same commitment: a guarantee that residents’ utility bills won’t go up. Of the 2,576 opposed counties, 1,244 are one commitment away, 594 need a package deal, and 738 have no deal; of those, 359 need three or more commitments and 379 have no package that suffices. Roughly seven in ten opposed counties are reachable with two commitments or fewer.
In 379 counties, led by Kentucky, Georgia, Tennessee, Kansas, and Colorado, no combination of the five commitments gets to solid majority support. Too much of the local opposition simply isn’t open to a win-win deal.