Case Studies
Build Effective Social and Behavior Change Strategies
")
Read More

Quantifying impact and change over the course of a project can prove challenging, especially when primary data collection is difficult. Increasingly, international development organizations are turning to advanced types of data and analysis that offer faster, more comprehensive insights than traditional approaches. For example, the use of machine learning (ML) can radically transform evaluations by integrating large and disparate datasets. Reliable predictive models can now identify, quantify, and illuminate trends at the local level. At Fraym, we map our machine-learning generated data to enable community-level, comprehensive evaluation with less primary data collection– saving our partners time and money, and decreasing risk.
Diving deeper to better understand impact
Geospatial data provides an alternative to typical project evaluations that deliver unique insights. For example, our Geospatial Impact Evaluation (GIE) methodology allows teams to assess a program’s impact across a range of spatial or location-based indicators regardless of national or subnational boundaries. Using ML, we pair microdata from professionally enumerated surveys with remotely sensed data and satellite imagery to produce heatmaps of key indicators. Comparing localized data over time without data collection can be used to determine the cause and effect of a program investment area. By capturing snapshots from different dates and times, and then combining them, we produce a GIE with testable, scientifically robust results.
Evaluating investments
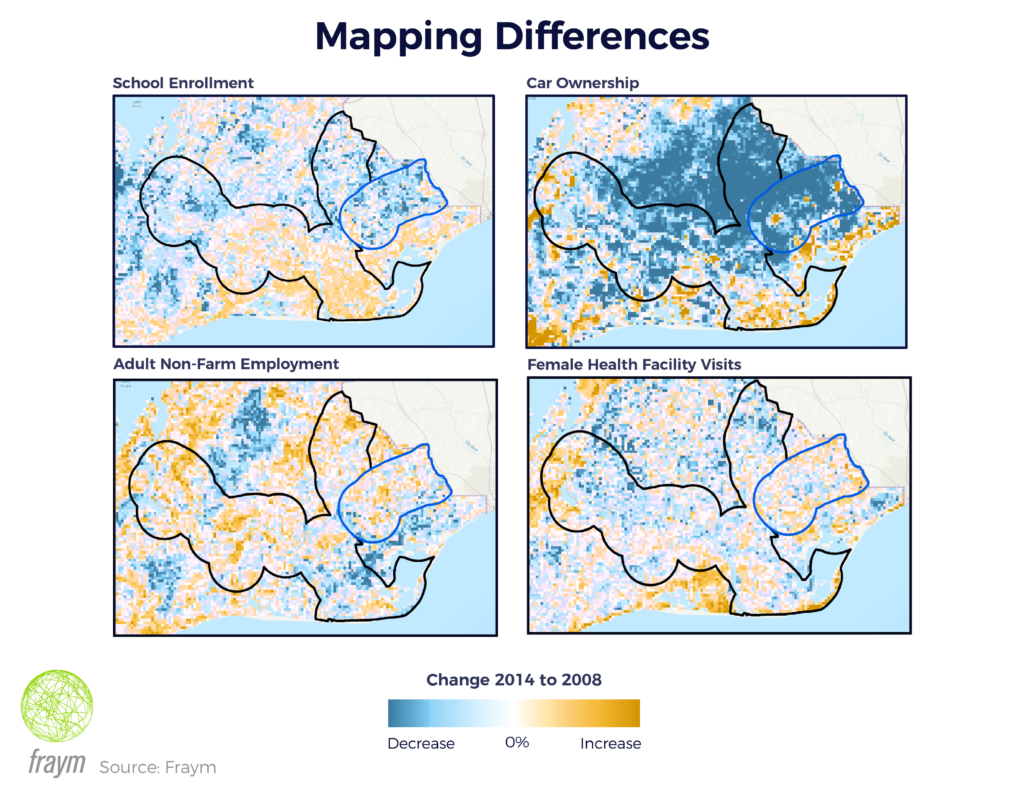
For example, we recently conducted a geospatial impact evaluation of a multilateral development bank-funded road corridor investment in southeast Ghana. Our goal was to understand the impact of the road project on multiple socioeconomic factors – including school enrollment, employment, asset ownership, and health indicators. In order to do so, Fraym compared the rehabilitated road corridor with a number of similar roads over a six-year period. With our foundational datasets identified from 2008 to 2014, Fraym examined the set of similar roads for use as a counterfactual. Out of four candidates, Fraym selected the corridor with the most similar baseline characteristics within ten-kilometer buffers surrounding the treatment and non-treatment roads.
From there, Fraym was able to quickly assess changes in the buffer zones for a number of indicators in both the treatment and counterfactual areas. For example, Fraym found that child school enrollment increased by over 1.4 percentage points in treatment communities as compared to communities around the counterfactual corridor.
Crucially, Fraym highlighted these and other changes using solely pre-existing datasets, machine learning, and remote analysis. This methodology adds new layers to evaluations, and allows evaluation teams to test the robustness of the results. With ML technology, Fraym is expanding the depth and breadth of traditional evaluations – and offering new solutions that maintain quality even in challenging environments.

