Blog
How Climate and Gender Vulnerability Intersect in Malawi

Learn More

Focus on Affordability
Undernutrition poses a threat to the lives of millions of children globally. A lack of micronutrients early in their lives can impact brain development, overall health, and can even lead to premature death. One component of food quality is the presence of micronutrients such as iodine, iron, and vitamin A. Large scale food fortification aims to target this specific component of malnutrition by inserting these micronutrients into certain foods when they are processed and packaged for sale.
Although the cost-effective approach to combating malnutrition has incredible potential, it is not currently enforced in all countries. As such, we need to understand the reach and barriers to fortified and fortifiable food consumption to ensure those most in need of nutrient rich foods can get them.
In response to this challenge, Fraym designed the Fortified Food Access Index to unpack the critical components that drive access in Nigeria, Ethiopia, and two states in India (Uttar Pradesh and Bihar). Specifically, the index uses household access as a proxy measure of whether a fortified food vehicle is present in the household.
The index is composed of four categories broken down into household level indicators:
Our hypothesis is that household indicators included in these four categories will provide insight into why households may not currently be consuming fortified foods and help identify the most effective strategy to increase coverage.
Affordability
Through the combination of existing data and primary data collection, Fraym will analyze what causes the lack of access in different communities and how that influences whether fortified food vehicles are consumed in these households.
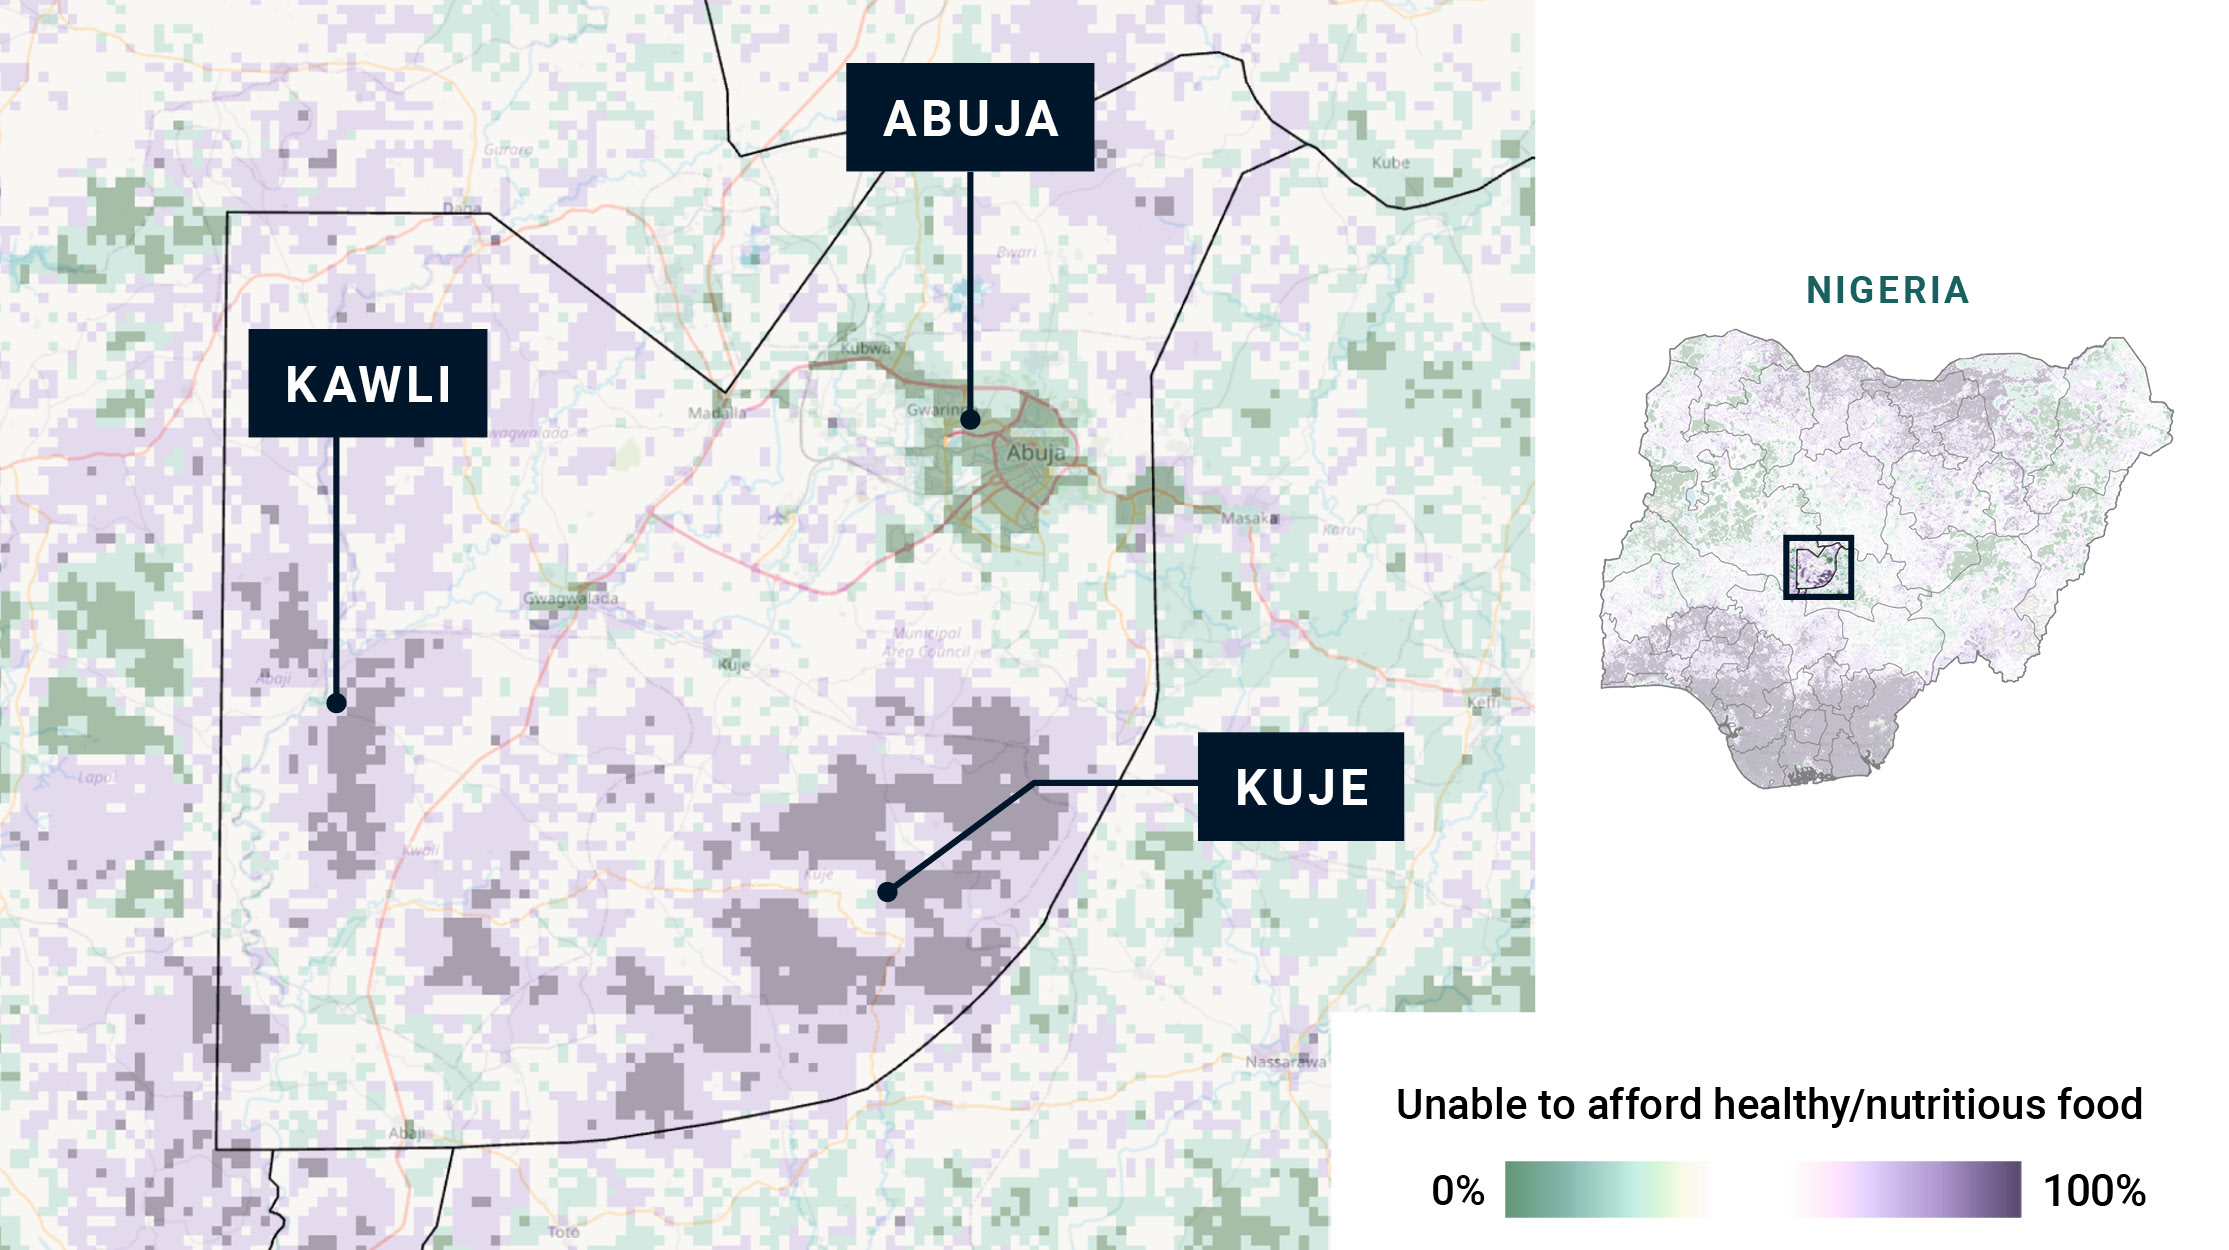
For example, we can look at an indicator of Affordability:
The proportion of adults (18+) who live in a household that report being unable to eat healthy and nutritious foods in the past 30 days because of lack of money1.
Sub-National Variation
Zooming in to the Federal Capital Territory (FCT) state of Nigeria, there is substantial variation in this measure of food insecurity.
At the state level:
Sub-state differences exist:
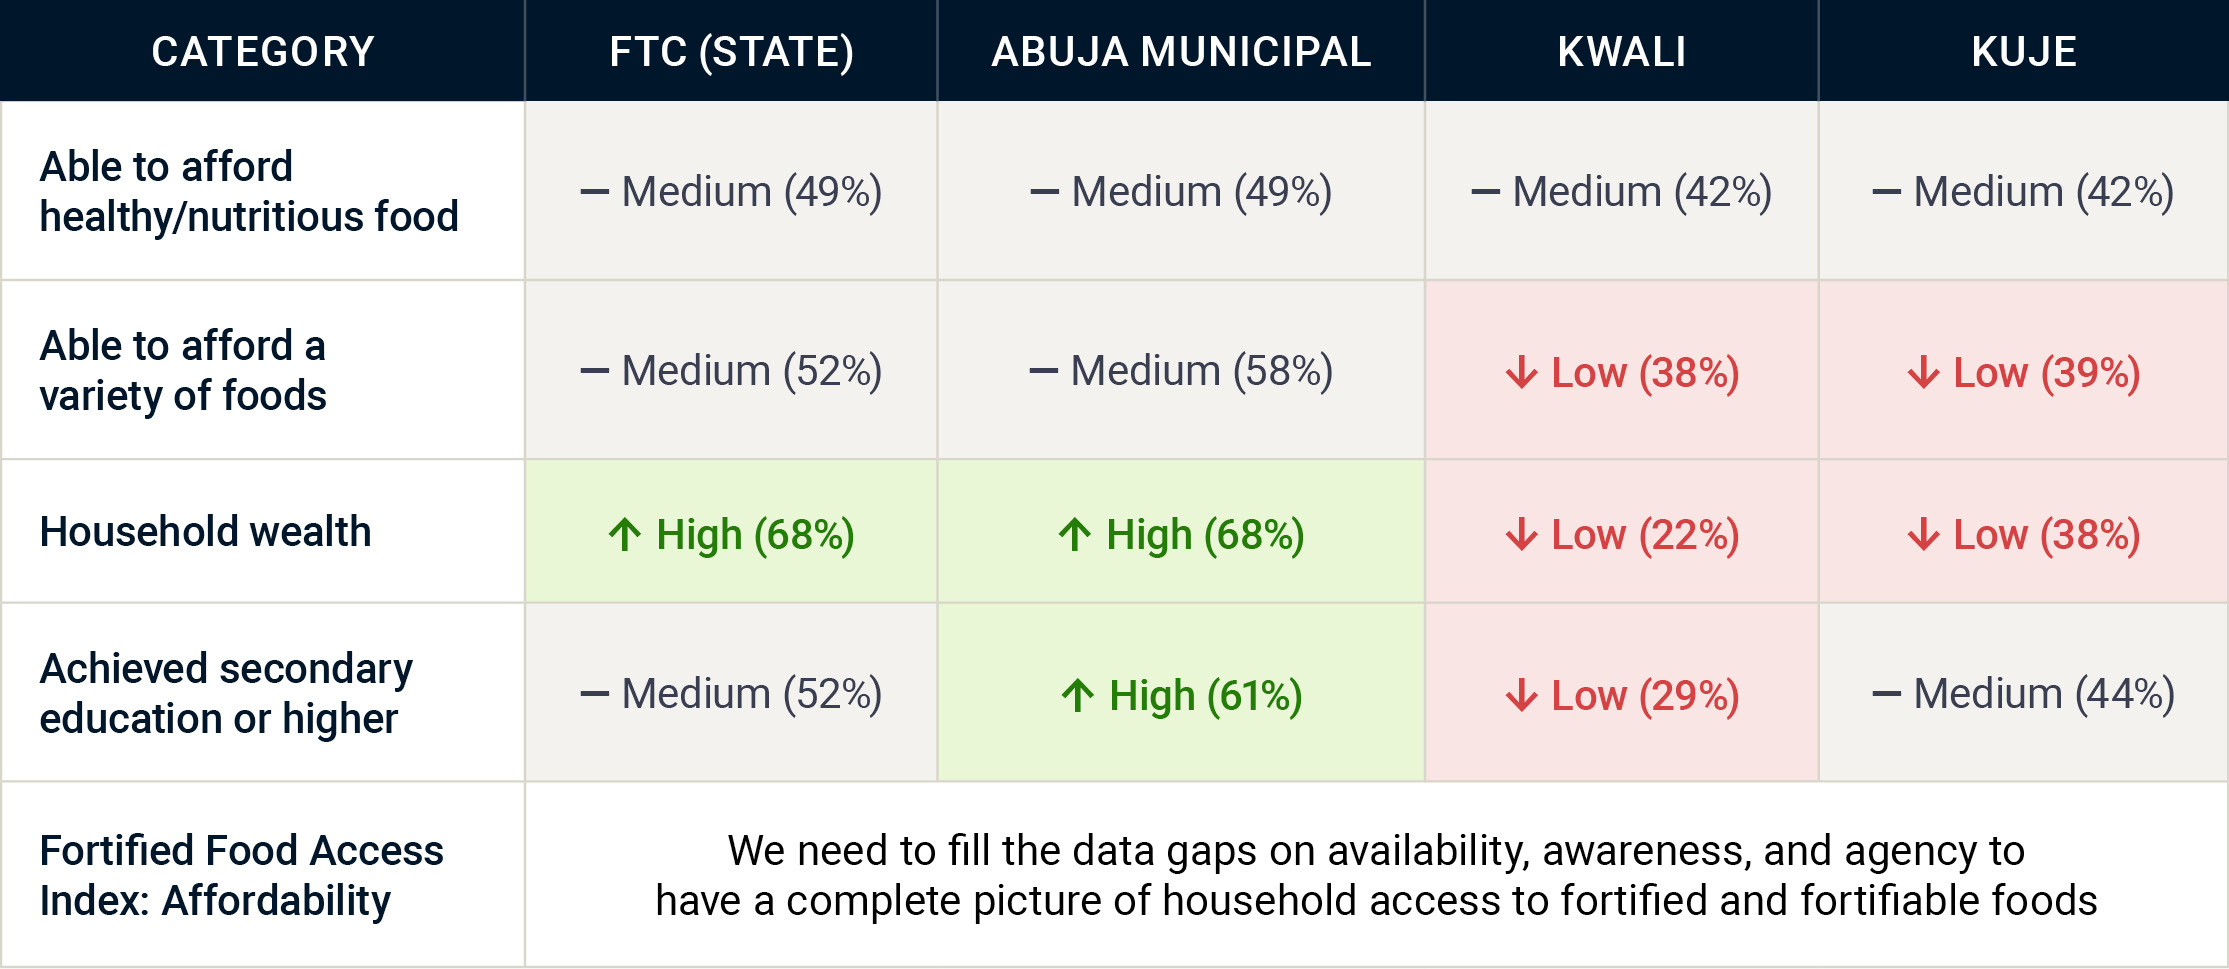
Why is there so much variation?
From the summary statistics below, we can see that households in LGAs like Kwali are also far less wealthy and have lower levels of secondary education than the state average – additional factors correlated with the inability to afford fortified foods.
Understanding these additional demographic factors helps policymakers design interventions or target social programs to focus on specific populations. Affordability is only one component of the Fortified Food Access Index; over the next year we will collect data to fill additional gaps in availability, agency, and awareness.
Next Steps
Fraym is in the process of producing novel indicators related to large scale food fortification and nutrition. Over a two year period, we will produce and update a set of subnational data for each component of the index to better understand (1) who is being reached with fortified foods, (2) who has the potential to be reached with fortified foods, and (3) who might be missed in the current approach to rolling out a fortified food strategy in three countries. Keep watching this space as we launch the first set of data for Nigeria in the next few months.
____________________
1 2018-2019 Nigeria General Household Survey
To learn more or connect with the team, email Melissa Persaud at [email protected].

