Blog
Who will bear the brunt of urban food shortages?

Read More

The Challenge
Inequitable diets – and specifically the ability to meet the minimum requirements of a nutritious diet – reinforces the cycle of poverty, impedes women and children from reaching their potential, engenders preventable deaths, and undermines communities’ development. Furthermore, conflict, climate change, continued effects of the COVID-19 pandemic, and rising food prices around the world are unlikely to affect communities and population groups uniformly—emphasizing the need for a precise understanding of household access to fortified foods to determine how to improve coverage in addressing malnutrition.
The Approach
National and state-level data does not provide the local information needed to fully inform high-impact investment in nutrition. Fraym will fill this critical gap by developing a Fortified Food Access Index in three countries to identify hyperlocal variation in the current availability, affordability, agency, and awareness around fortified foods at the community level.
Components of this framework will be mapped sub-nationally to deliver local insights into the drivers of fortified food coverage – a key component of nutrient adequacy. These outputs and key findings will be available via Fraym’s resource center, and disseminated in a series of future blog posts.
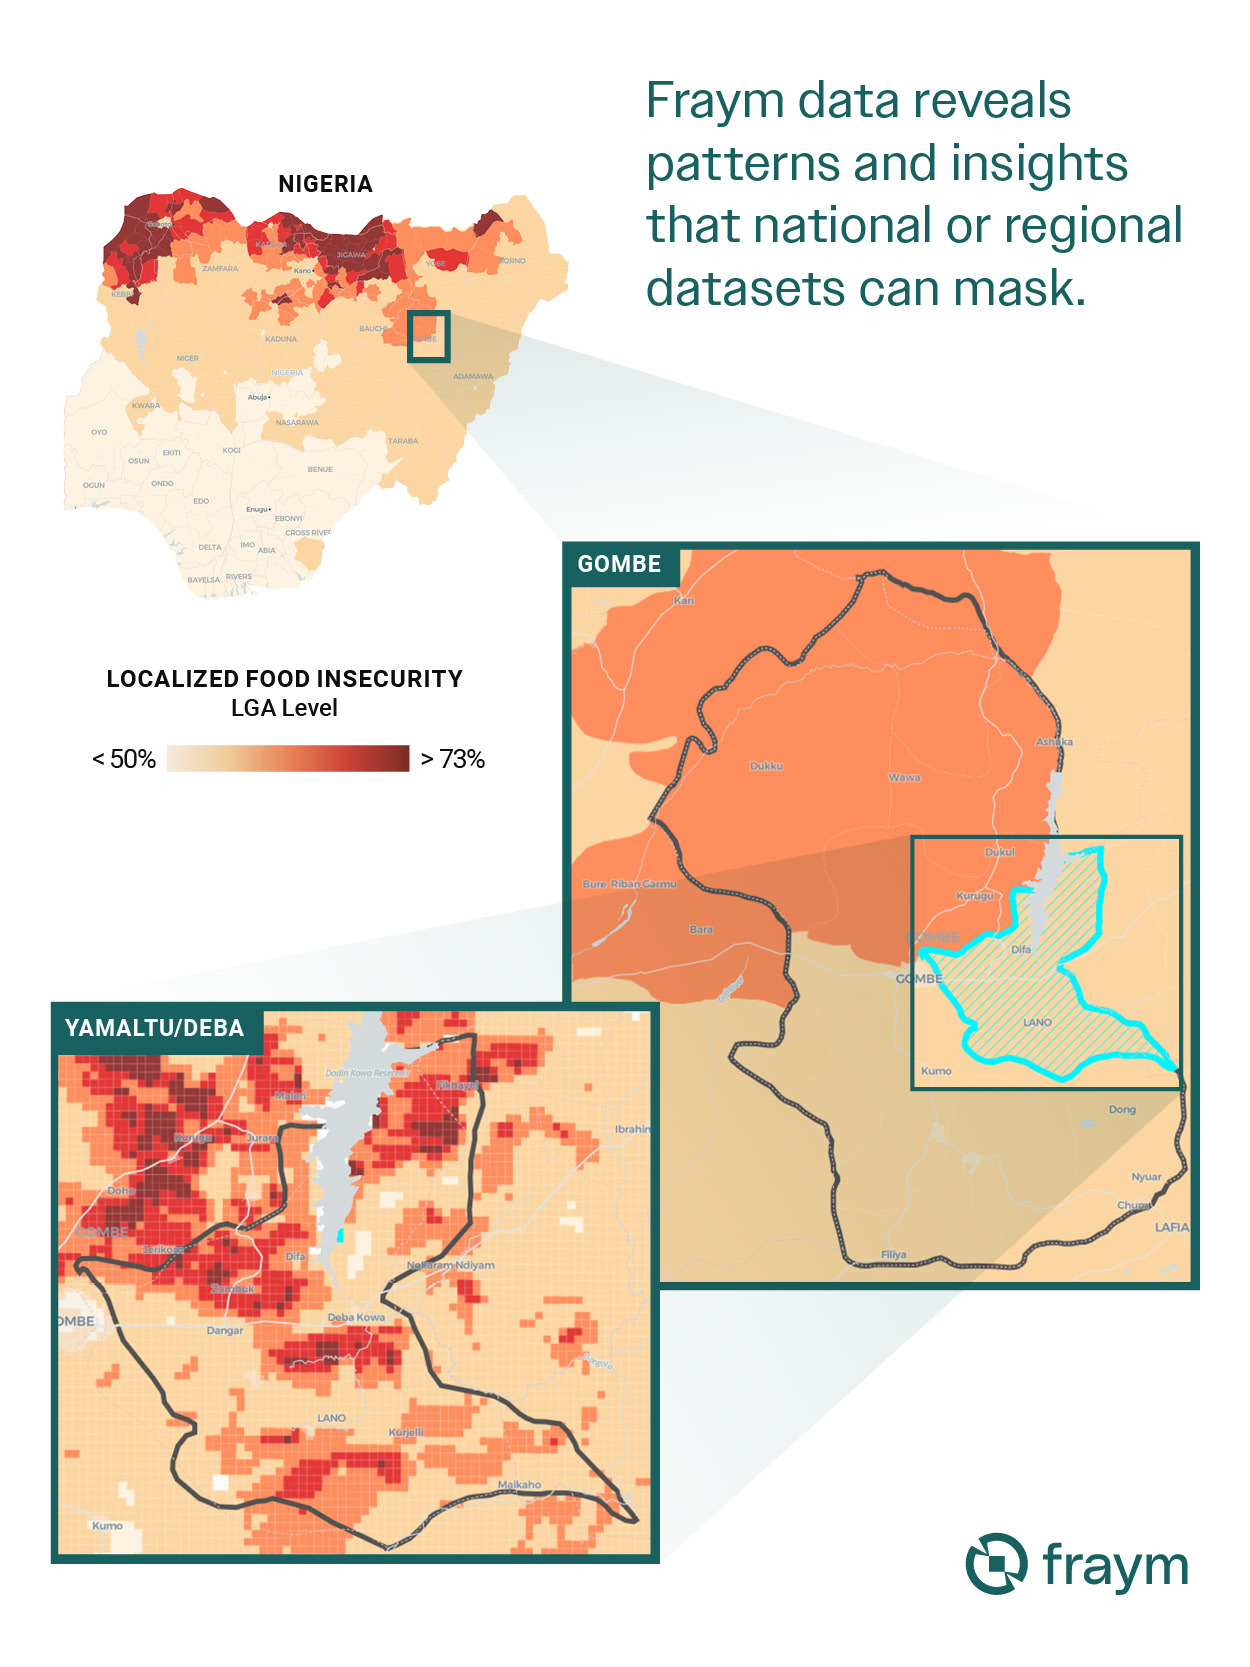
For example, Fraym will produce State, LGA, and hyperlocal datasets in Nigeria for indicators such as food insecurity as a component of food access using machine learning models that turn national household level surveys into census-like spatial data across the entire country. In the visual above, we see that Gombe is moderately food insecure – with a food insecurity score of 65 out of 100 – compared to the national average of 51, yet when we zoom into the LGA view we see that the southern parts of Gombe State are less food insecure then the north.
Further zooming in, Fraym data highlights the Yamaltu/Deba LGA as an area where aggregate statistics mask significant hyperlocal differences. While this LGA has a food insecurity score of 66 out of 100, there are communities in the region that score as high as 73 and as low as 50 on the food insecurity scale – a 23-point swing. Only at the 1 km2 level can we see the drastic variation in an area that appeared to have similar food insecurity levels as the state average.
What’s Next
Over the next two years, Fraym will build on this work and produce a full suite of component indicators to measure fortified food access in three countries. The result will be a comprehensive, subnational proxy measure for fortified food coverage to inform programming, policy, and investment in this critical component of nutrition programming. To understand more about our framework and approach, download our inception report.

