Case Studies
Build Effective Social and Behavior Change Strategies
")
Read More

Often, increasing healthcare access requires more than opening a clinic. Using geospatial data, we researched the physical, demographic, and social factors that impact a woman’s ability to visit a facility. Below is an outline of how we’d use the Fraym analysis to approach program design.
To start, we looked at the female population of Kenya at the national level. In 2015, only 65 percent of women had visited a health facility in the past year, and northern Kenyan counties had the highest concentrations of women not visiting a clinic. Marsabit and Turkana, which are marked with a low presence of health facilities, have particularly high concentrations of non-visiting women, where over 60 percent of women did not visit a facility.
Next, we compared women who did and did not go to a clinic. Here’s where we start seeing some differences that help us understand our target audience a bit better.
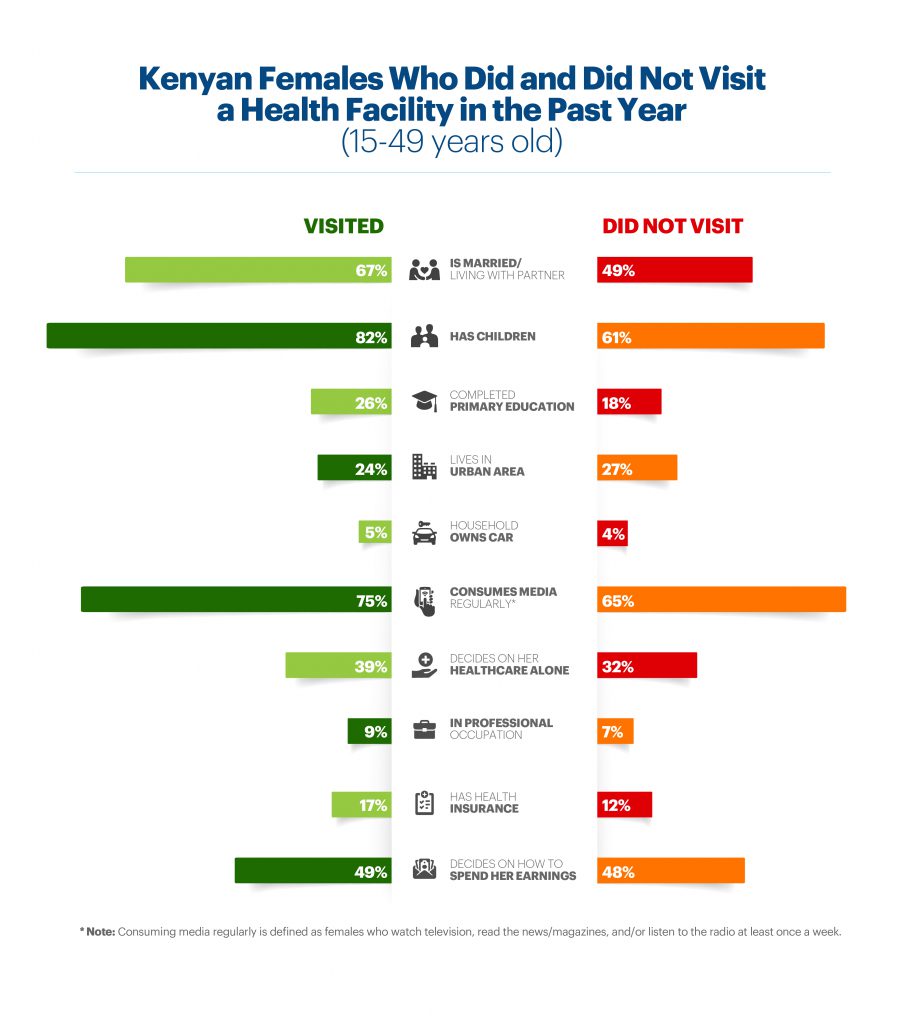
Some notable differing characteristics between women who visited and did not visit the clinic include: their marital status, if they have children, and if they consume media regularly. Equipped with this information, we can start thinking about how where to find the women who do not visit health facilities regularly.
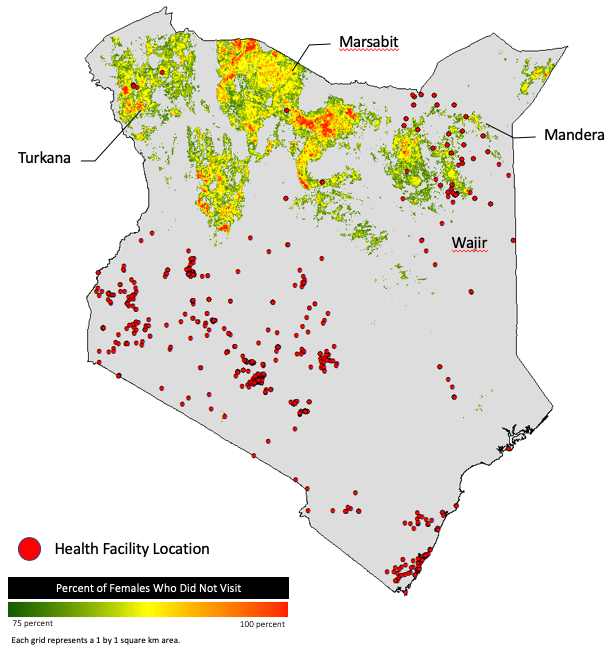
Then we looked at where those non-visiting women live. If we zoom into the northeast regions, we see a higher concentration of non-visitors as compared to the rest of the country. Pairing who the non-visiting women are and where they live with the location of health facilities exposes some new trends. First, we see where facilities are in relation to women who did not visit clinics recently. Second, we can confirm that most non-visitors are in areas where there are fewer clinics. Despite there being fewer facilities in the north, we can still geospatially confirm that there are significant proportions of non-visiting women living near a health facility – confirming that facility availability does not equal access.
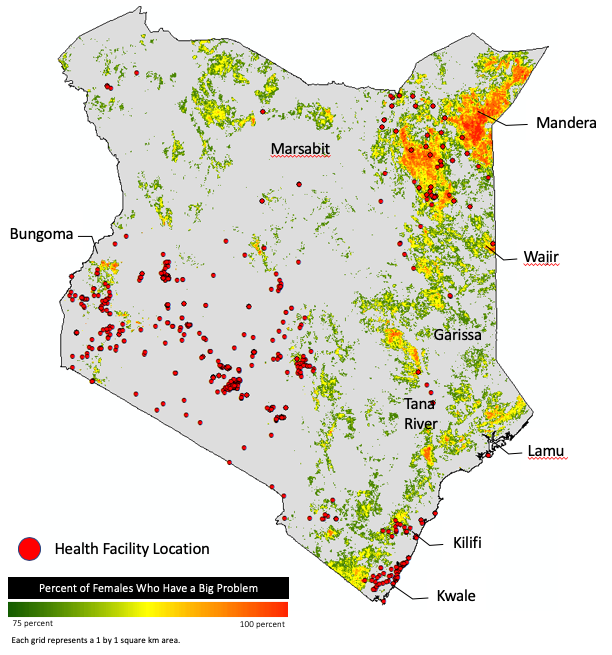
So what is keeping our non-visiting women from visiting the clinic? We were able to identify key reasons women reported as barriers to visiting a clinic and noted some major obstacles including getting permission to go, distance to health facility, getting money needed for treatment, and not wanting to go alone. Our final map highlights the concentration of non-visiting women facing these major obstacles to visiting a health facility. If we zoom into the northeastern part of Kenya again, we see that the women who do not go to the clinic are facing these major barriers. Equipped with this geospatial and beneficiary profiling information, we can start to think about which additional quantitative and qualitative data we would like to collect to better understand the circumstances our target beneficiaries are facing and design targeted interventions that differ by community and target audience.

