Blog
Mapping America’s Information Blind Spots

Read More
Blog

Roughly 40 million Americans — about 15% of U.S. adults — say BOTH that social media is their main news source AND that news “finds them” rather than the other way around. They aren’t subscribing. They aren’t searching. They’re scrolling, and the algorithm decides what counts as news.
Fraym’s census-tract-level data pinpoints where this passive social media “news” consumption is especially concentrated – in roughly 5,900 census tracts home to roughly 18 million people. We see the greatest clustering in rural counties across the Mississippi Delta, the Texas-Mexico border, California’s Central Valley, Appalachia, and the Plains.

And once you look at the broader data in these tracts, several trends stand out…
First, this population is defined by economic disadvantage, not life stage. The stereotypical picture of a “passive algorithmic news consumer” is a twenty-something scrolling TikTok because newspapers feel hopelessly last century. The data tells a different story.
These communities have almost exactly the same age profile as the country as a whole. This clearly isn’t a story about pockets of digitally-obsessed Zoomers.
Instead, poverty in these tracts runs roughly 5 percentage points higher than the national average (18.1% vs. 13.2%), and the share of adults with a high school degree or less is 7 percentage points higher (51.5% vs. 44.4%). And they have higher unemployment (6.1% vs. 4.6%), on average. These are all statistically-significant gaps — each one substantial on its own.
So, we’re seeing poorer, more economically distressed places where the local information economy may have thinned out — where local journalism may have weakened, and a national social-media feed has filled the vacuum.
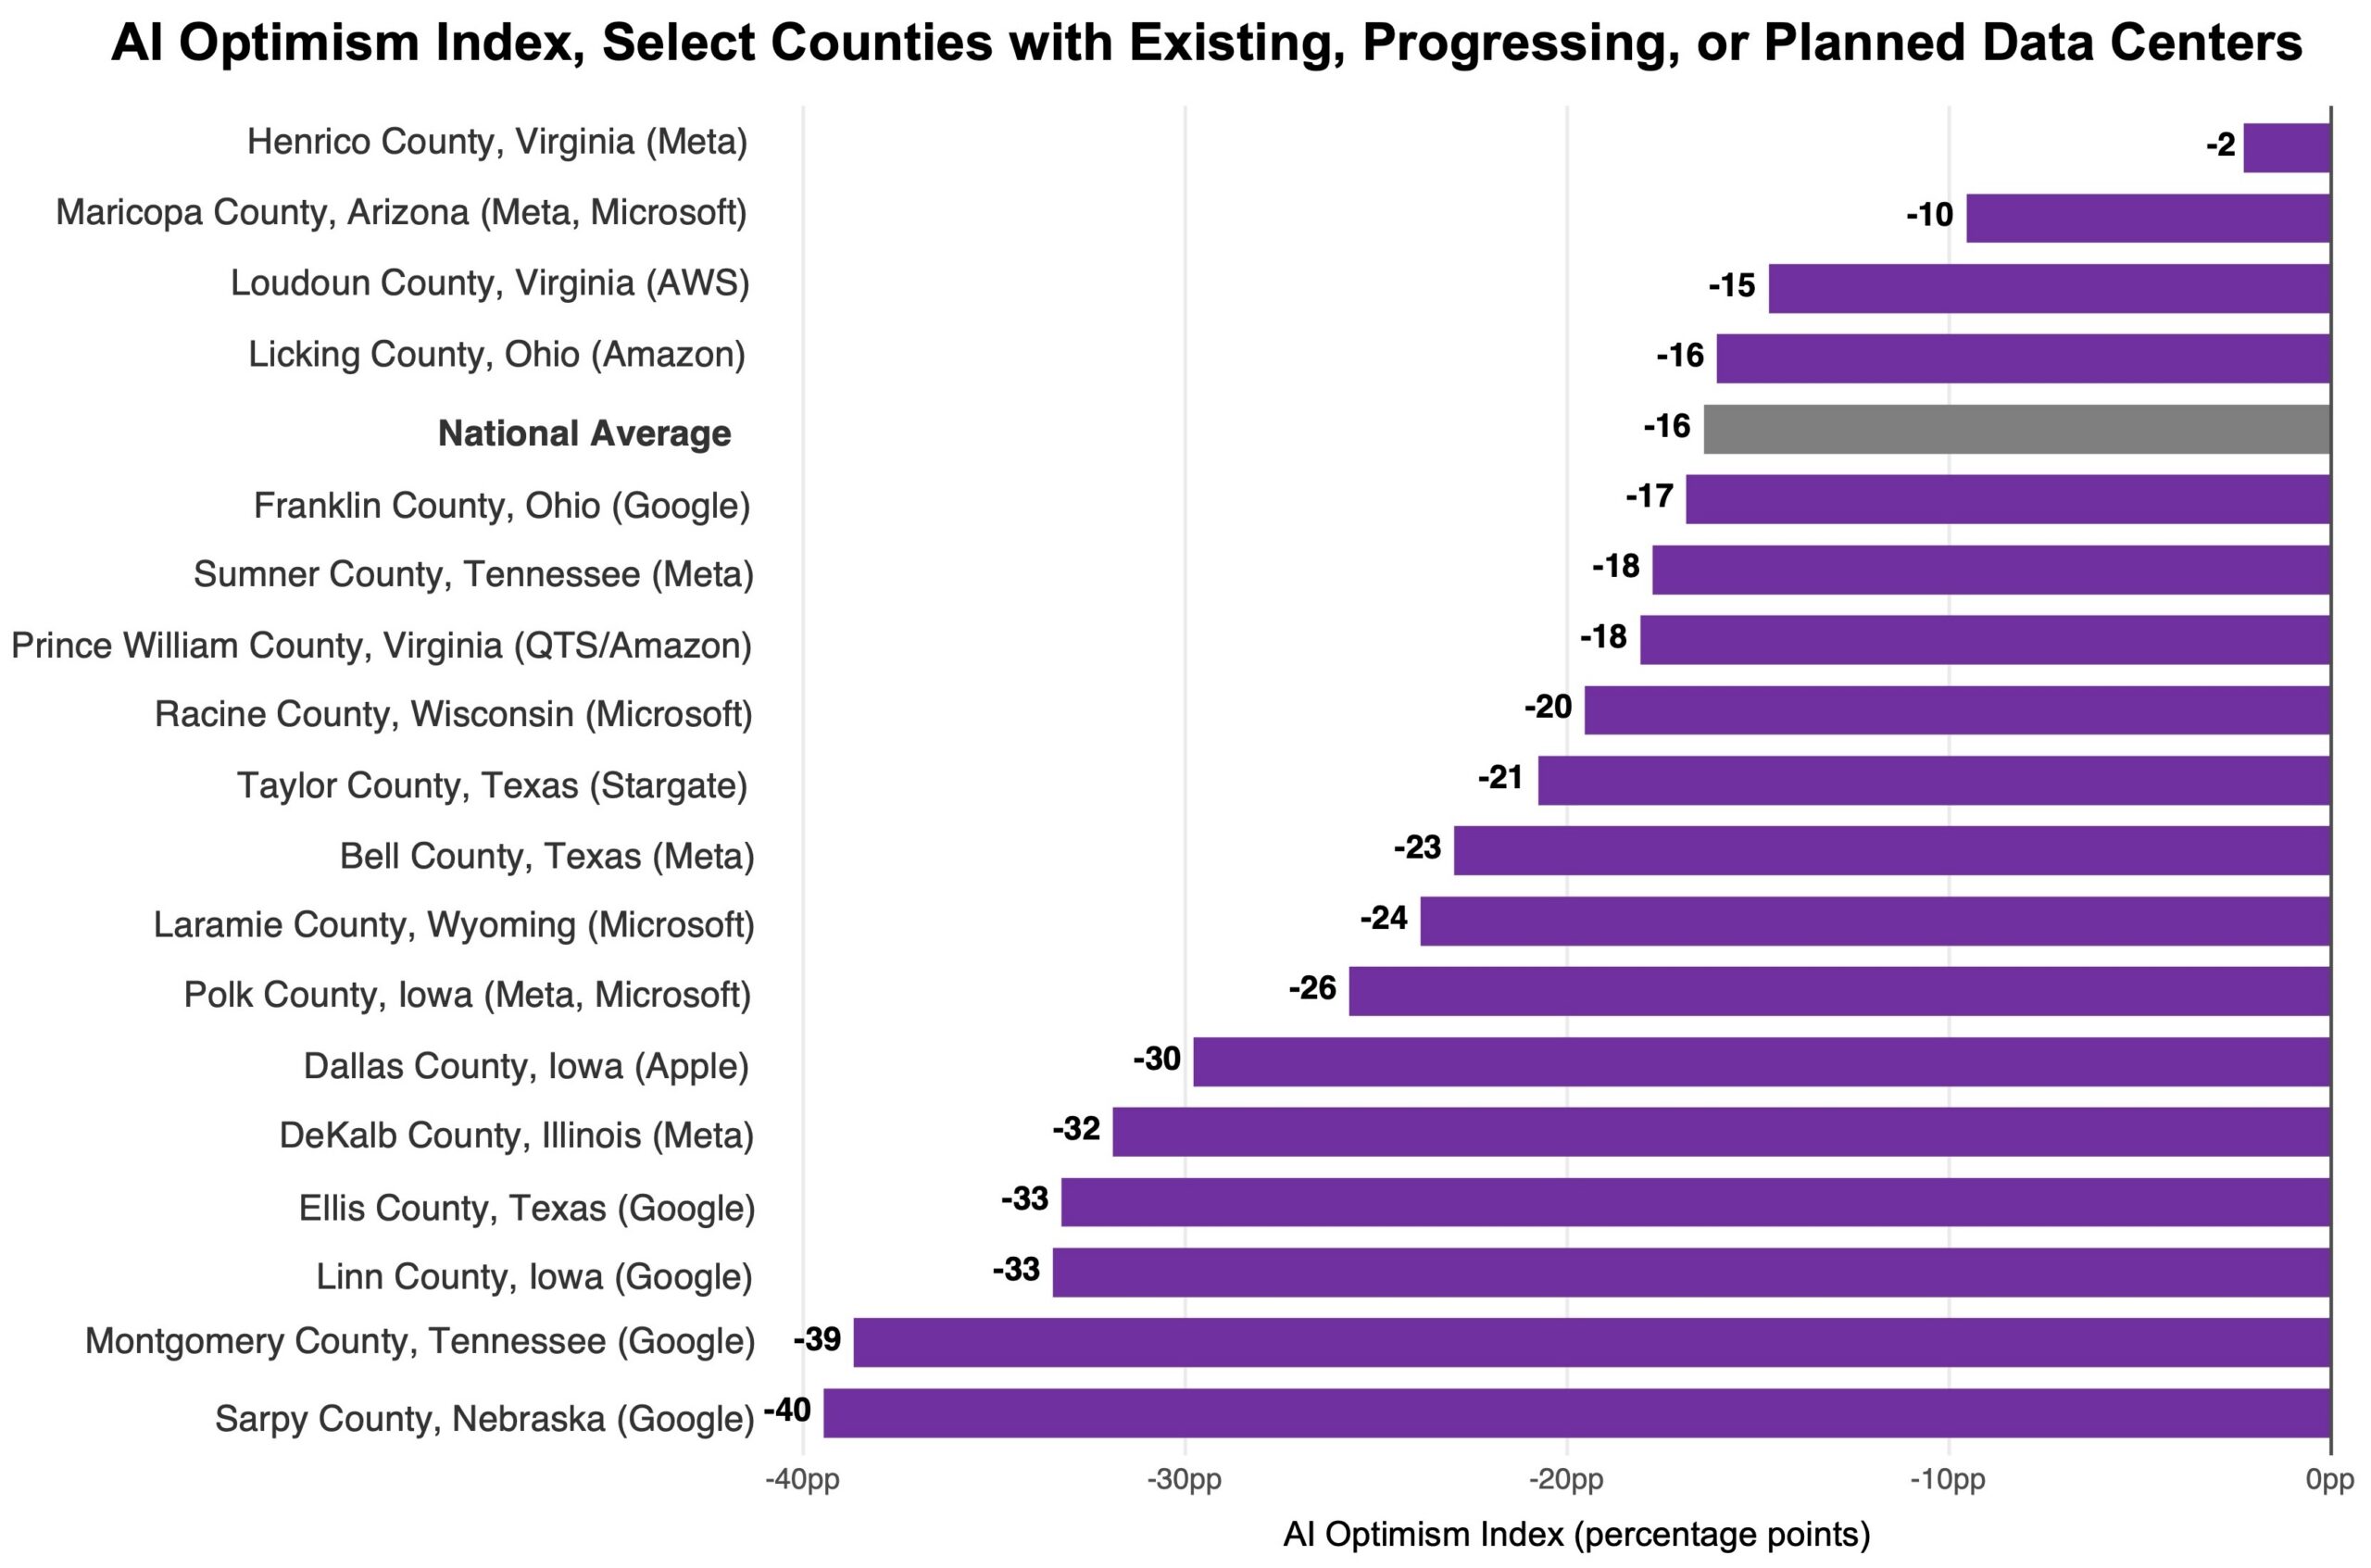
Source: Fraym data (2025) and analysis. Cohort census tracts are in the top quartile on both “social media is my main news source” and “news finds me / the algorithm suggests it”
Second, cohort census tract residents are cynical – but not about everything. They trust the federal government and state government at about the national rate. They distrust news media and politicians at about the national rate. They have about the same number of close friends and actually trust their own families slightly more than average.
What they distrust, specifically and measurably, is what’s closest to them: their local government and their own community. On those two measures, cohort tracts show a distrust lift several times larger than on any national measure. And the gap survives after controlling for income and education levels.
That rules out the easy explanations. It isn’t a poverty story — if it were, the pattern would disappear once we adjust for income and education. It doesn’t. It isn’t generalized disaffection — if it were, distrust of the federal government would move too. It isn’t social withdrawal — interpersonal trust is intact.
Something about the information diet, or the conditions surrounding it, correlates with a narrow, specific pattern of distrust in local institutions.

Third, people living in these census tracts have a markedly different media diet from that of the average American adult. Fraym monitors tract-level consumption for over a hundred media assets – including national news outlets and podcasts – each month, and when we line up cohort tracts against the rest of the country, the pattern doesn’t divide cleanly along left-right lines.
What drops out of their media diet is legacy news. Cohort tracts under-index on AP News (−14%), local news (−10%), the New York Times (−8%), and MSNBC (−5%) — the legacy news ecosystem.
What takes their place spans the ideological map. The World Socialist Web Site (+32%) and The Federalist (+32%) — a socialist publication and a hard-right website — tie at the top, alongside the All-In podcast (+27%), Science Vs (+19%), The Young Turks (+18%), Breaking Points (+15%), The Daily (+12%), Tucker Carlson (+11%), and Matt Walsh Show (+7%).
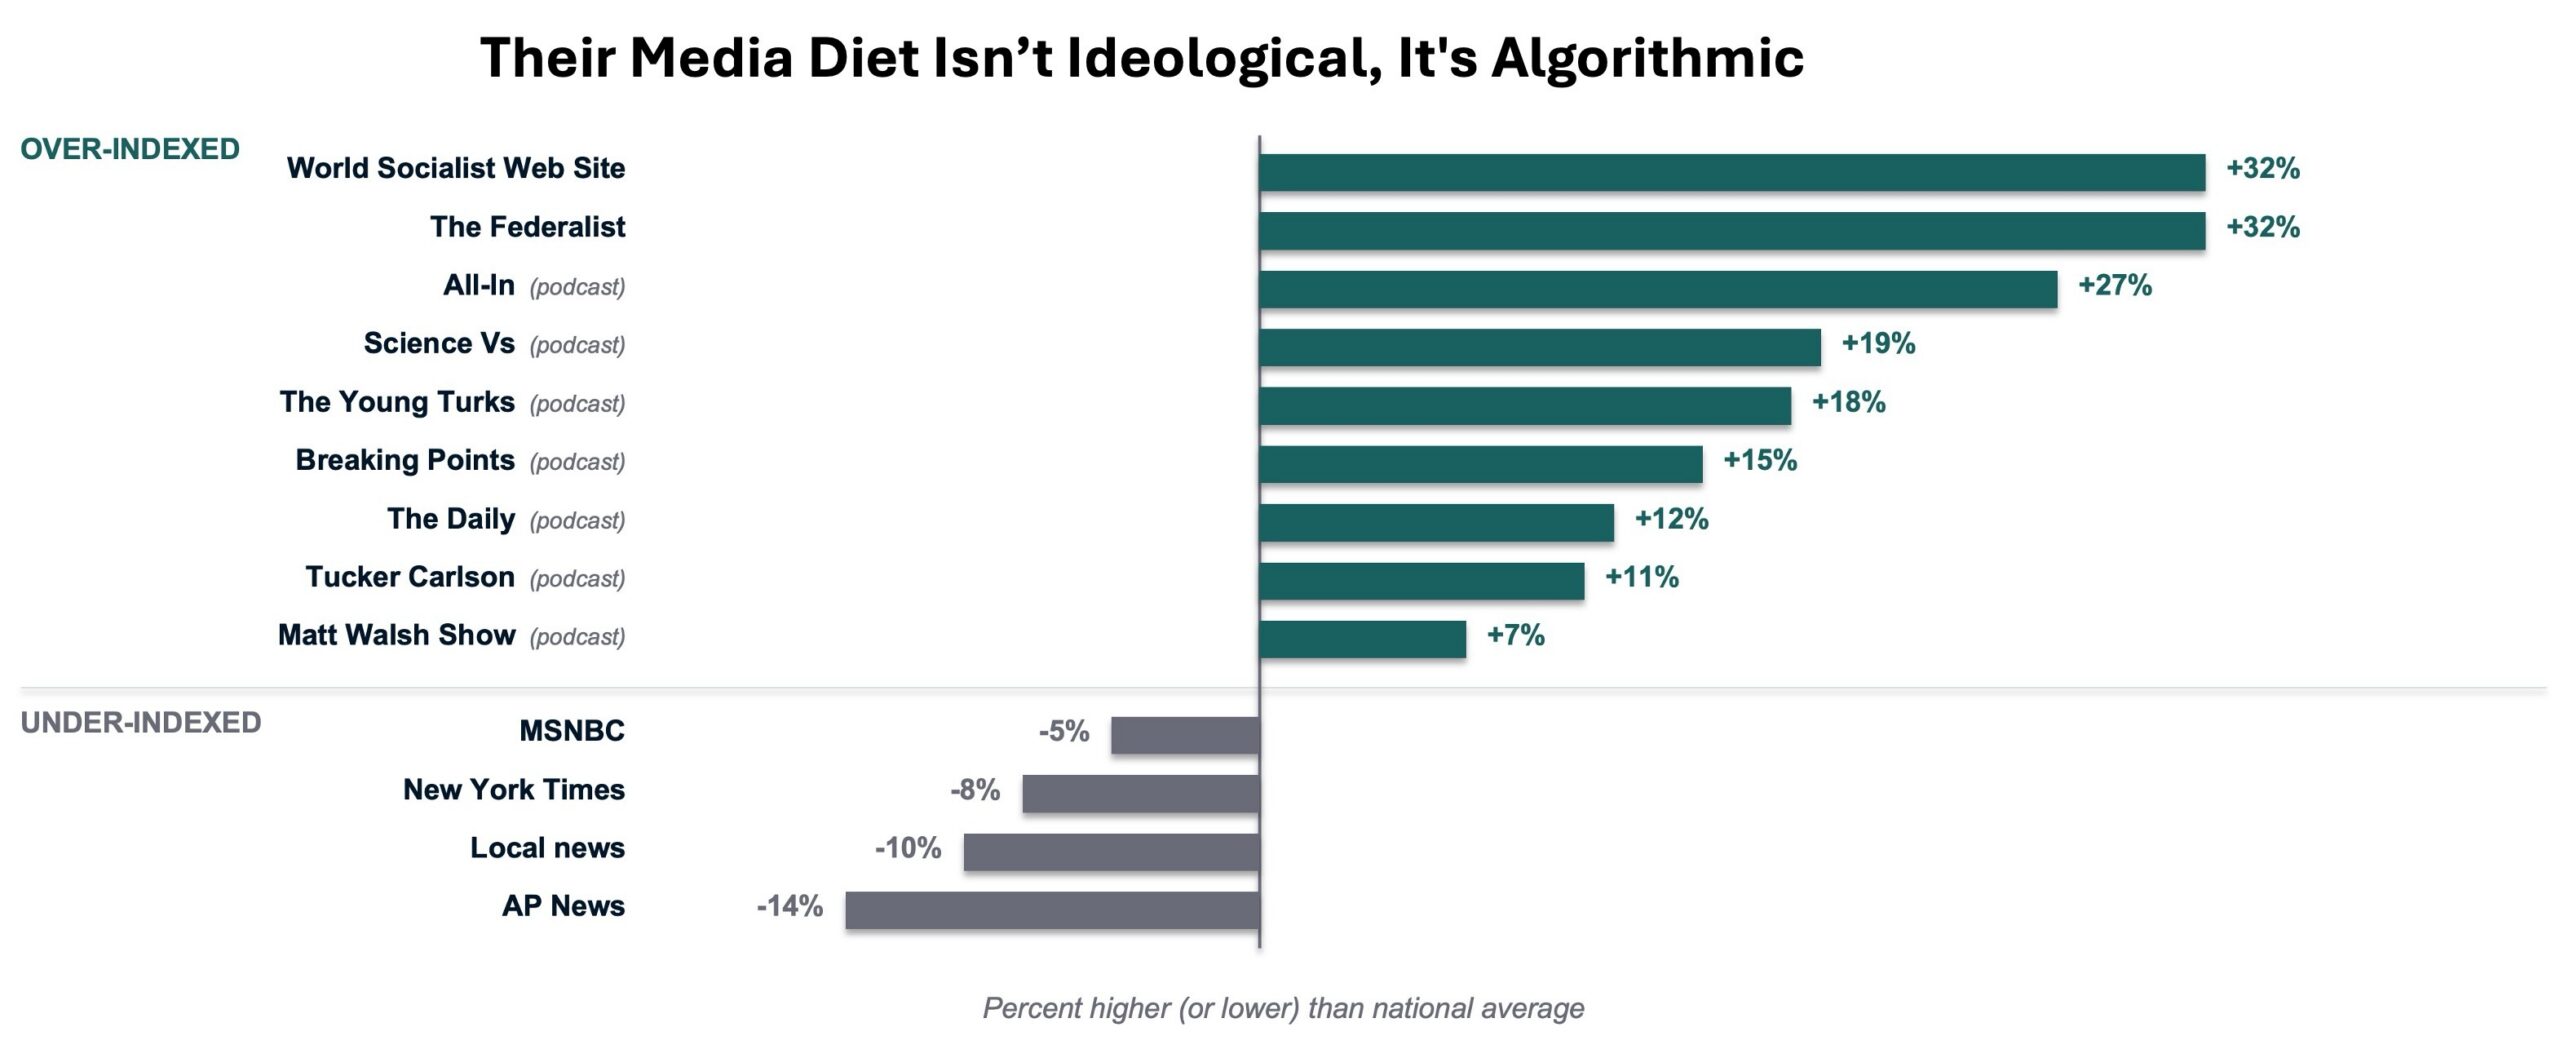
What unites these outlets is not ideology — it’s distribution. Each one is built for the kind of scroll-and-autoplay attention the algorithm rewards. Put differently, we’re not talking about a single politically polarized population; we’re talking about a highly informationally vulnerable population whose media diet spans the political spectrum.
Anyone trying to reach these people must work through the same distribution mechanics that have contributed to these patterns in the first place. National broadcast buys will miss them. But knowing exactly where to target geographically, whether in person or on over-indexed media platforms, will give civic engagement campaigns a massive decision advantage to start moving the needle.
Fraym tracks information vulnerabilities and hundreds of other issues each month across 84,000+ US census tracts. For more information about hyperlocal data and civic engagement campaign targeting, contact us at [email protected].