Case Studies
Calculating ROI for Caregiving Programs

Read More

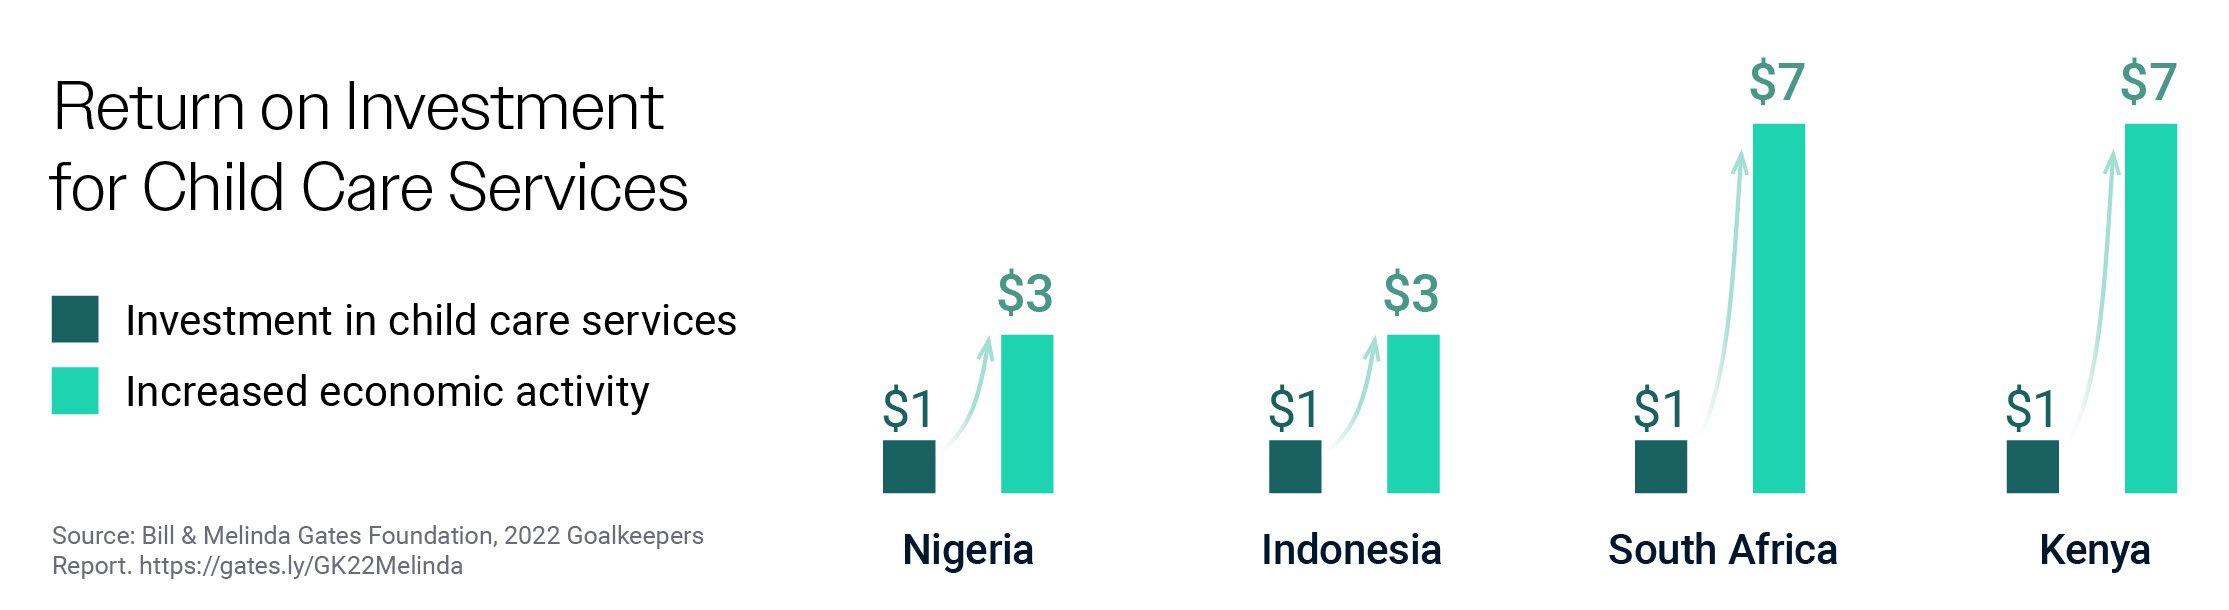
In 2022, Fraym conducted a cutting-edge study by using our novel, local-level data on population characteristics to assess the economic return on investing in care programs in five countries, achieving greater detail and precision than ever before possible. Our new approach brought together specific and actionable localized data with critical polling data on public support to create a powerful tool for advocacy, research, and action. Fraym’s findings were featured in the 2022 Goalkeepers report published by the Bill & Melinda Gates Foundation.
Below, we’ll outline the steps taken and distill each action in a way that can be scaled to any policy area of interest.
In this case, we identified the population of caregivers that would most likely enter or reenter the labor force in the event of a childcare focused intervention. This includes the subgroup of primary caregivers who:
In the case of assessing the economic benefits of a caregiving policy, we estimated the incremental potential household earnings that the identified primary caregiver population would expect to generate if they entered or reentered the labor force. Once determined, Fraym analysts classified the caregiver subpopulation by group and considered average earnings by category. Earning data is determined and validated by the country’s official labor force and household income data.
Next, average earnings estimates are multiplied by the proportion of primary caregivers who expect to enter or reenter the labor force if affordable and accessible childcare was available. This process creates a nationally representative estimate of what the average primary caregiver could expect to earn annually if they were to enter or reenter the labor force.
In order to assess the economic benefits of a policy, we must adequately account for the cost of a new program. For a caregiving policy, we calculate the costs of a hypothetical child caregiving intervention by assessing two primary cost drivers –
Multiplying these two components together creates a nationally representative cost estimate for covering child caregiving expenses for participating primary caregivers.
While it is enticing to assess economic returns with more aggressive assumptions, we understand the need for a realistic estimate that presents a policy as achievable and effective. As such, we recommend any policy simulation include conservative assumptions on population-level measures of ability as well as their desire to participate.
In this scenario, we discount the projected employment benefits using the most recent national unemployment rate. This acknowledges that not all primary caregivers may be able to find income generating activities. Further adjustments can be made to address barriers specific target populations may face, such as the fact that it may be more difficult for women to find employment in certain countries, regions, or communities. To further our conservative assumptions, we reduce the expected ROI benefits by the country’s corresponding unemployment rate while maintaining the expected costs at full value.
Last, we estimate the overall economic benefits by subtracting the estimated costs per person from the estimated benefits per person. The resulting figure projects the average economic benefit that primary caregivers would receive/generate if affordable and accessible child caregiving services were available in the country.
Pairing this robust approach to policy simulations with constituency-specific public support data provides a rich roadmap for advocacy, research, and action.
With access to local level data, advocates are equipped with a full package of data on the economic impacts and public support for such policies to drive change at all levels of government.
In the case of care programs, Support for was very high across all geographies studied, with some variations in certain regions.
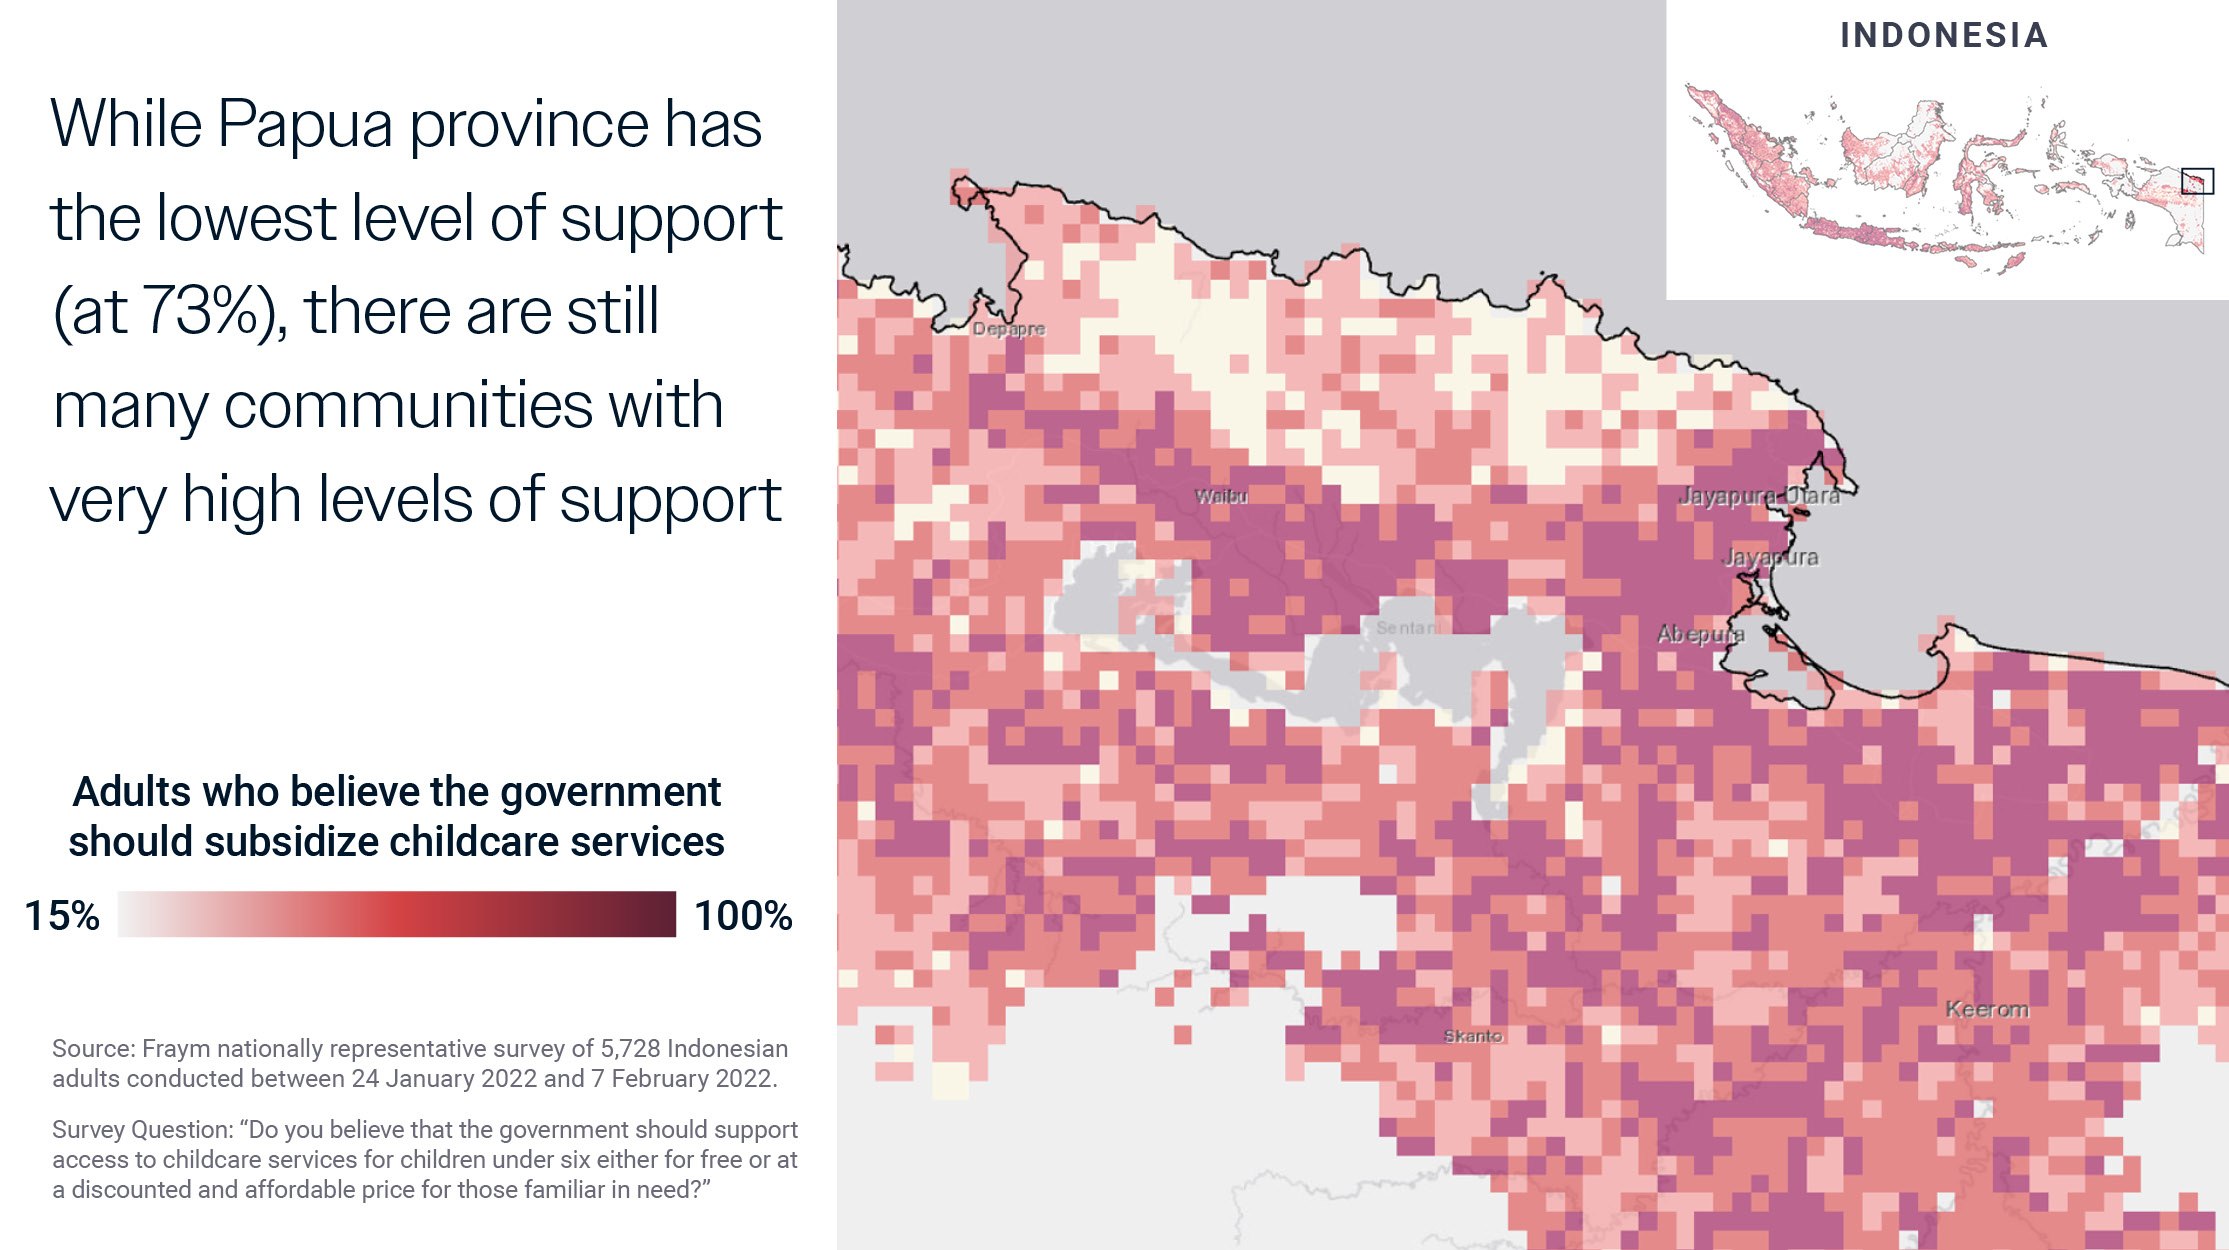
For example, 85% of Indonesians support care policies nationally. When this data is analyzed at the provincial level, we find Papua province has the lowest level of support (at 73%). However there are still many communities with very high levels of support, such as the areas in and around Jayapura, the provincial capital. Equipped with the power of Fraym, advocates and policymakers can understand dynamics at each constituency when making decisions.
For more details on the findings of our studies, See our Case Study or Download the Reports

