Blog
Black Maternal Mortality in the US: Short Case Study

Read More
Blog

Americans’ willingness to get a flu vaccine barely cracked 55% this season. A far cry from the CDC’s goal of 70% coverage. Those are the national figures. But national averages hide the story. Since September 2025, Fraym has tracked flu vaccination intentions monthly across more than 84,000 census tracts — the most granular view available of who plans to get vaccinated, who doesn’t, and crucially, where they live. This research builds on Fraym’s earlier groundbreaking partnership with leading public health organizations working to increase vaccine uptake nationwide.
Here are five insights from our most recent tracking and analysis that could help to shape next season’s campaigns.
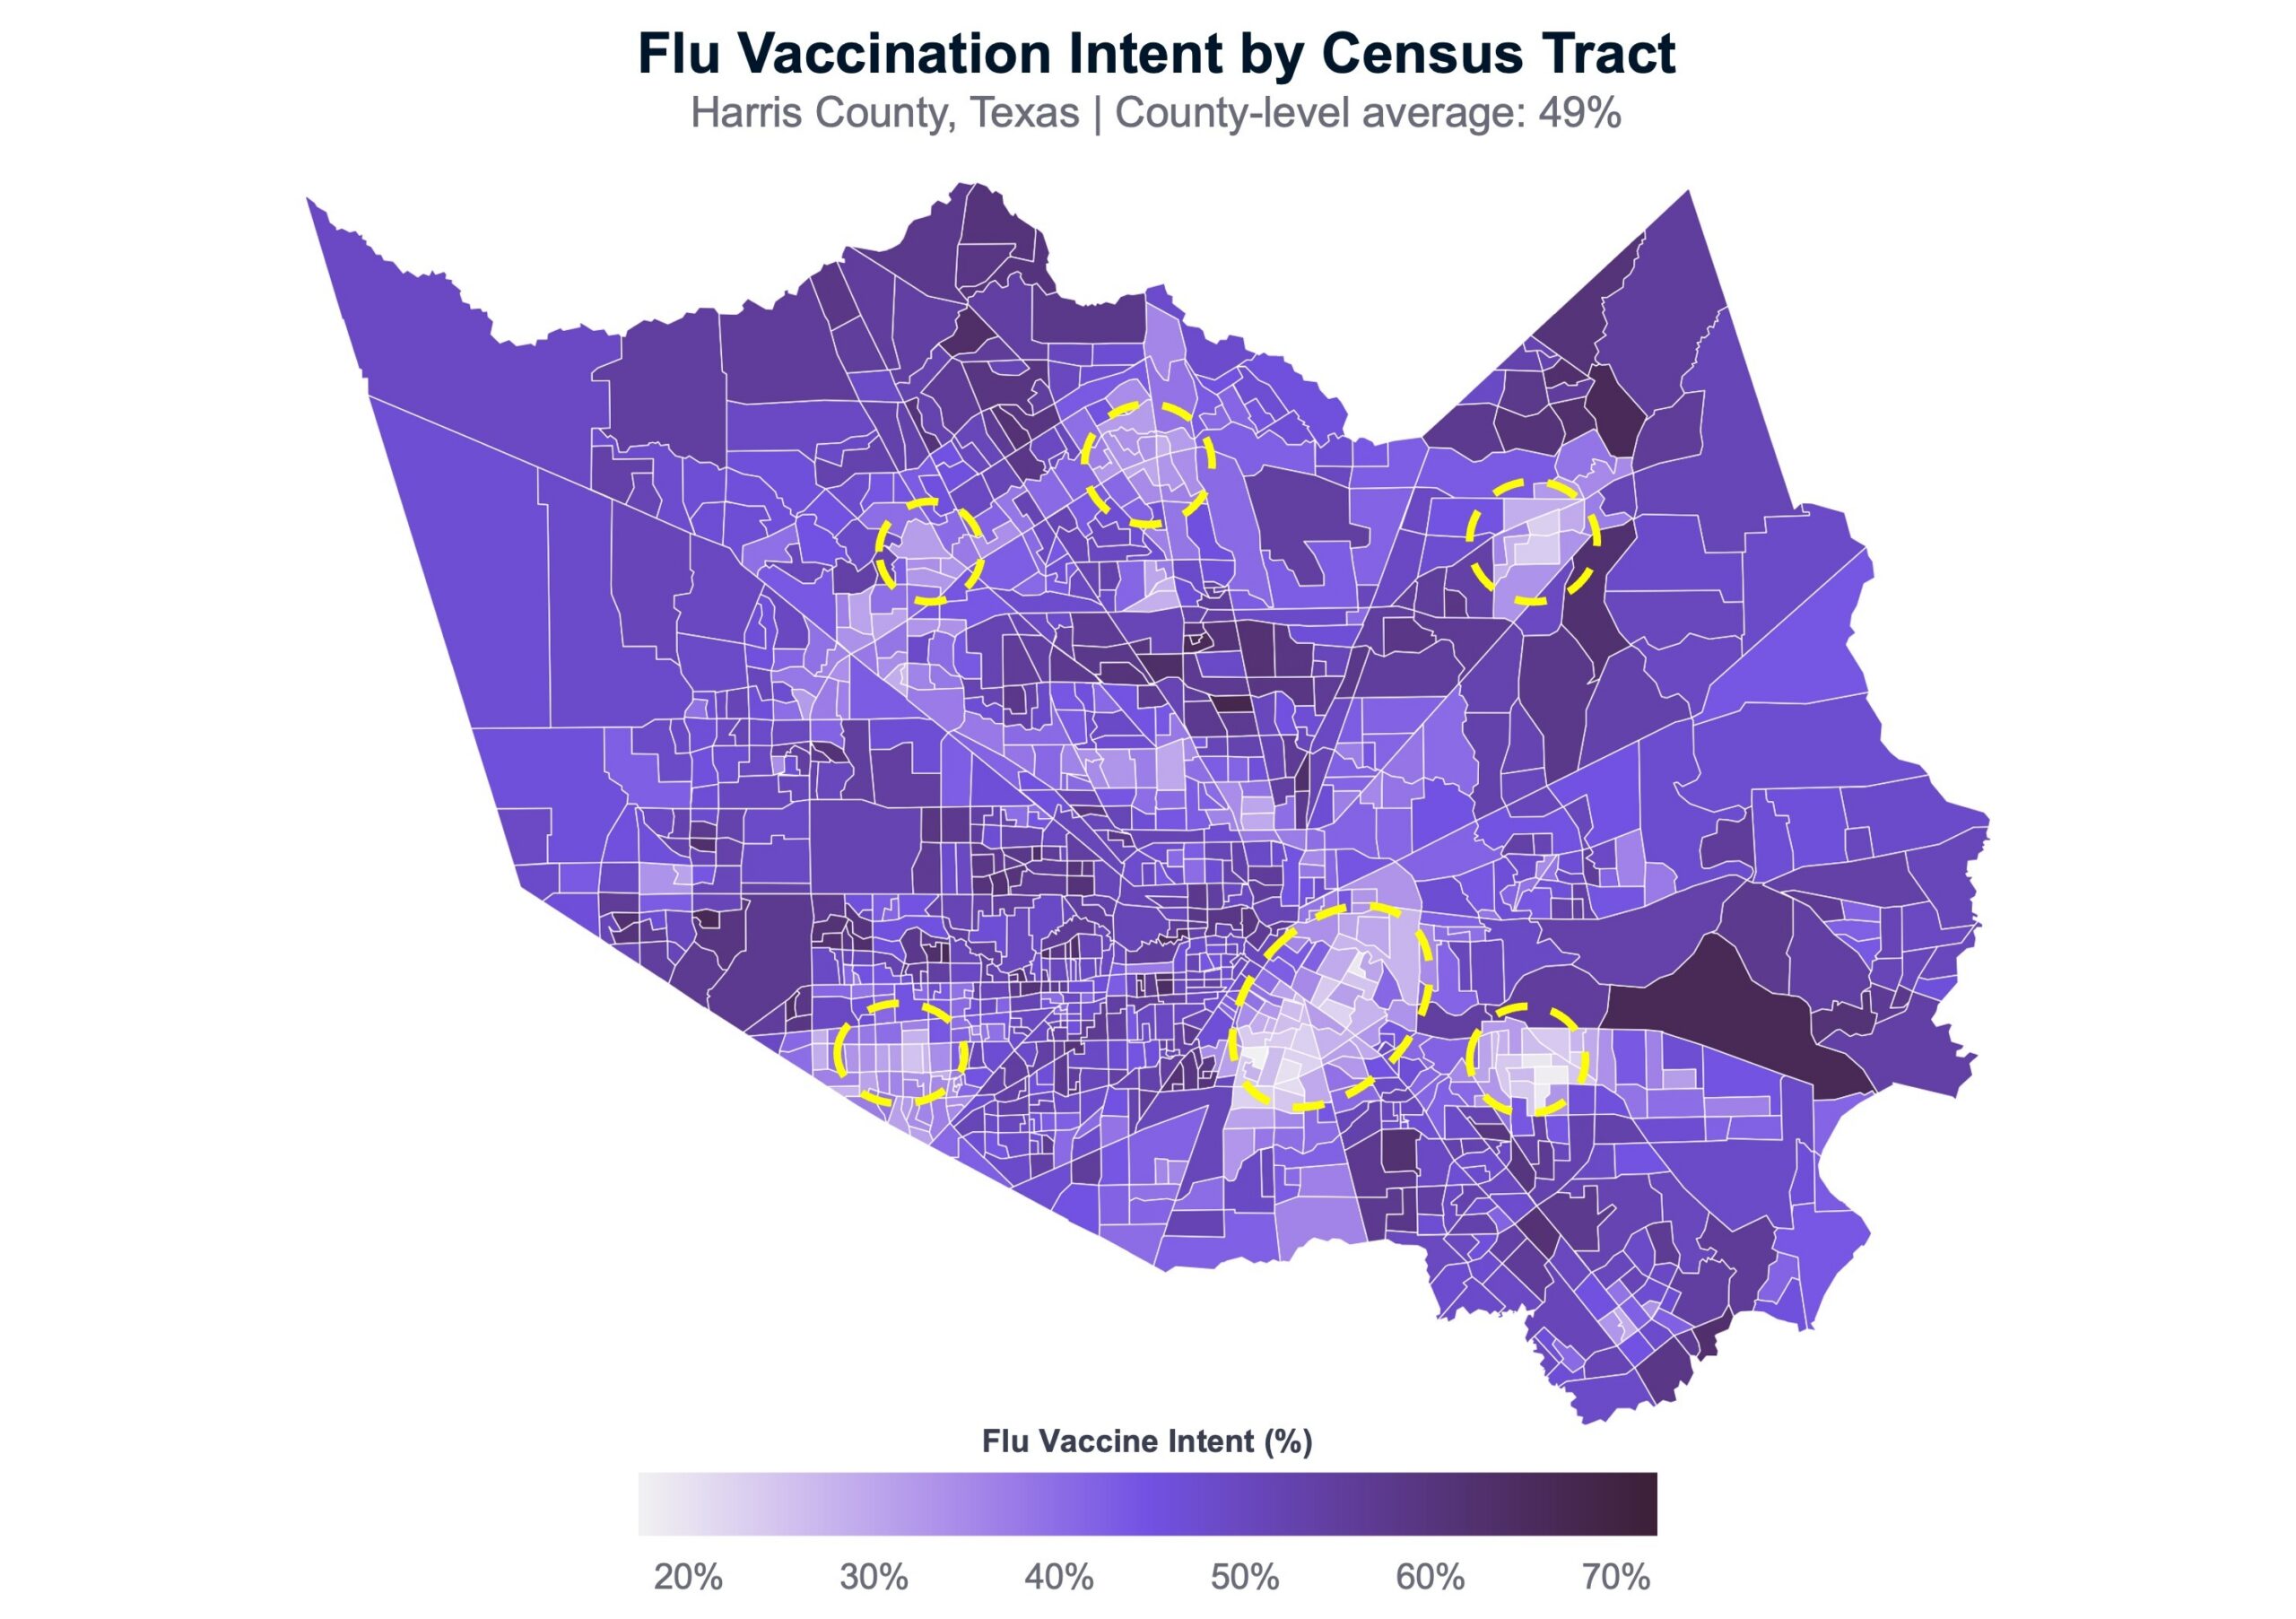
One of the most striking findings: a census tract’s vaccination intent is heavily influenced by the intent of surrounding tracts — even after accounting for demographics, institutional trust, political ideology, and media consumption. Take a look below at the 1,100+ census tracts in Harris County, Texas (the Houston metro area). You will immediately understand what I’m talking about. There are multiple, clear clusters of low-intent tracts, surrounded by clusters of much higher-intent tracts. This isn’t an anomaly; we see the same thing in almost every metro area.
This matters because it means vaccination attitudes aren’t just individual decisions shaped by individual characteristics. In many ways, they’re often implicitly collective — shaped by local social dynamics, shared information environments, and community norms. Campaigns that shift intent in one neighborhood may generate spillover effects in adjacent ones. And neighborhoods where intent is declining can pull their surroundings down with them.
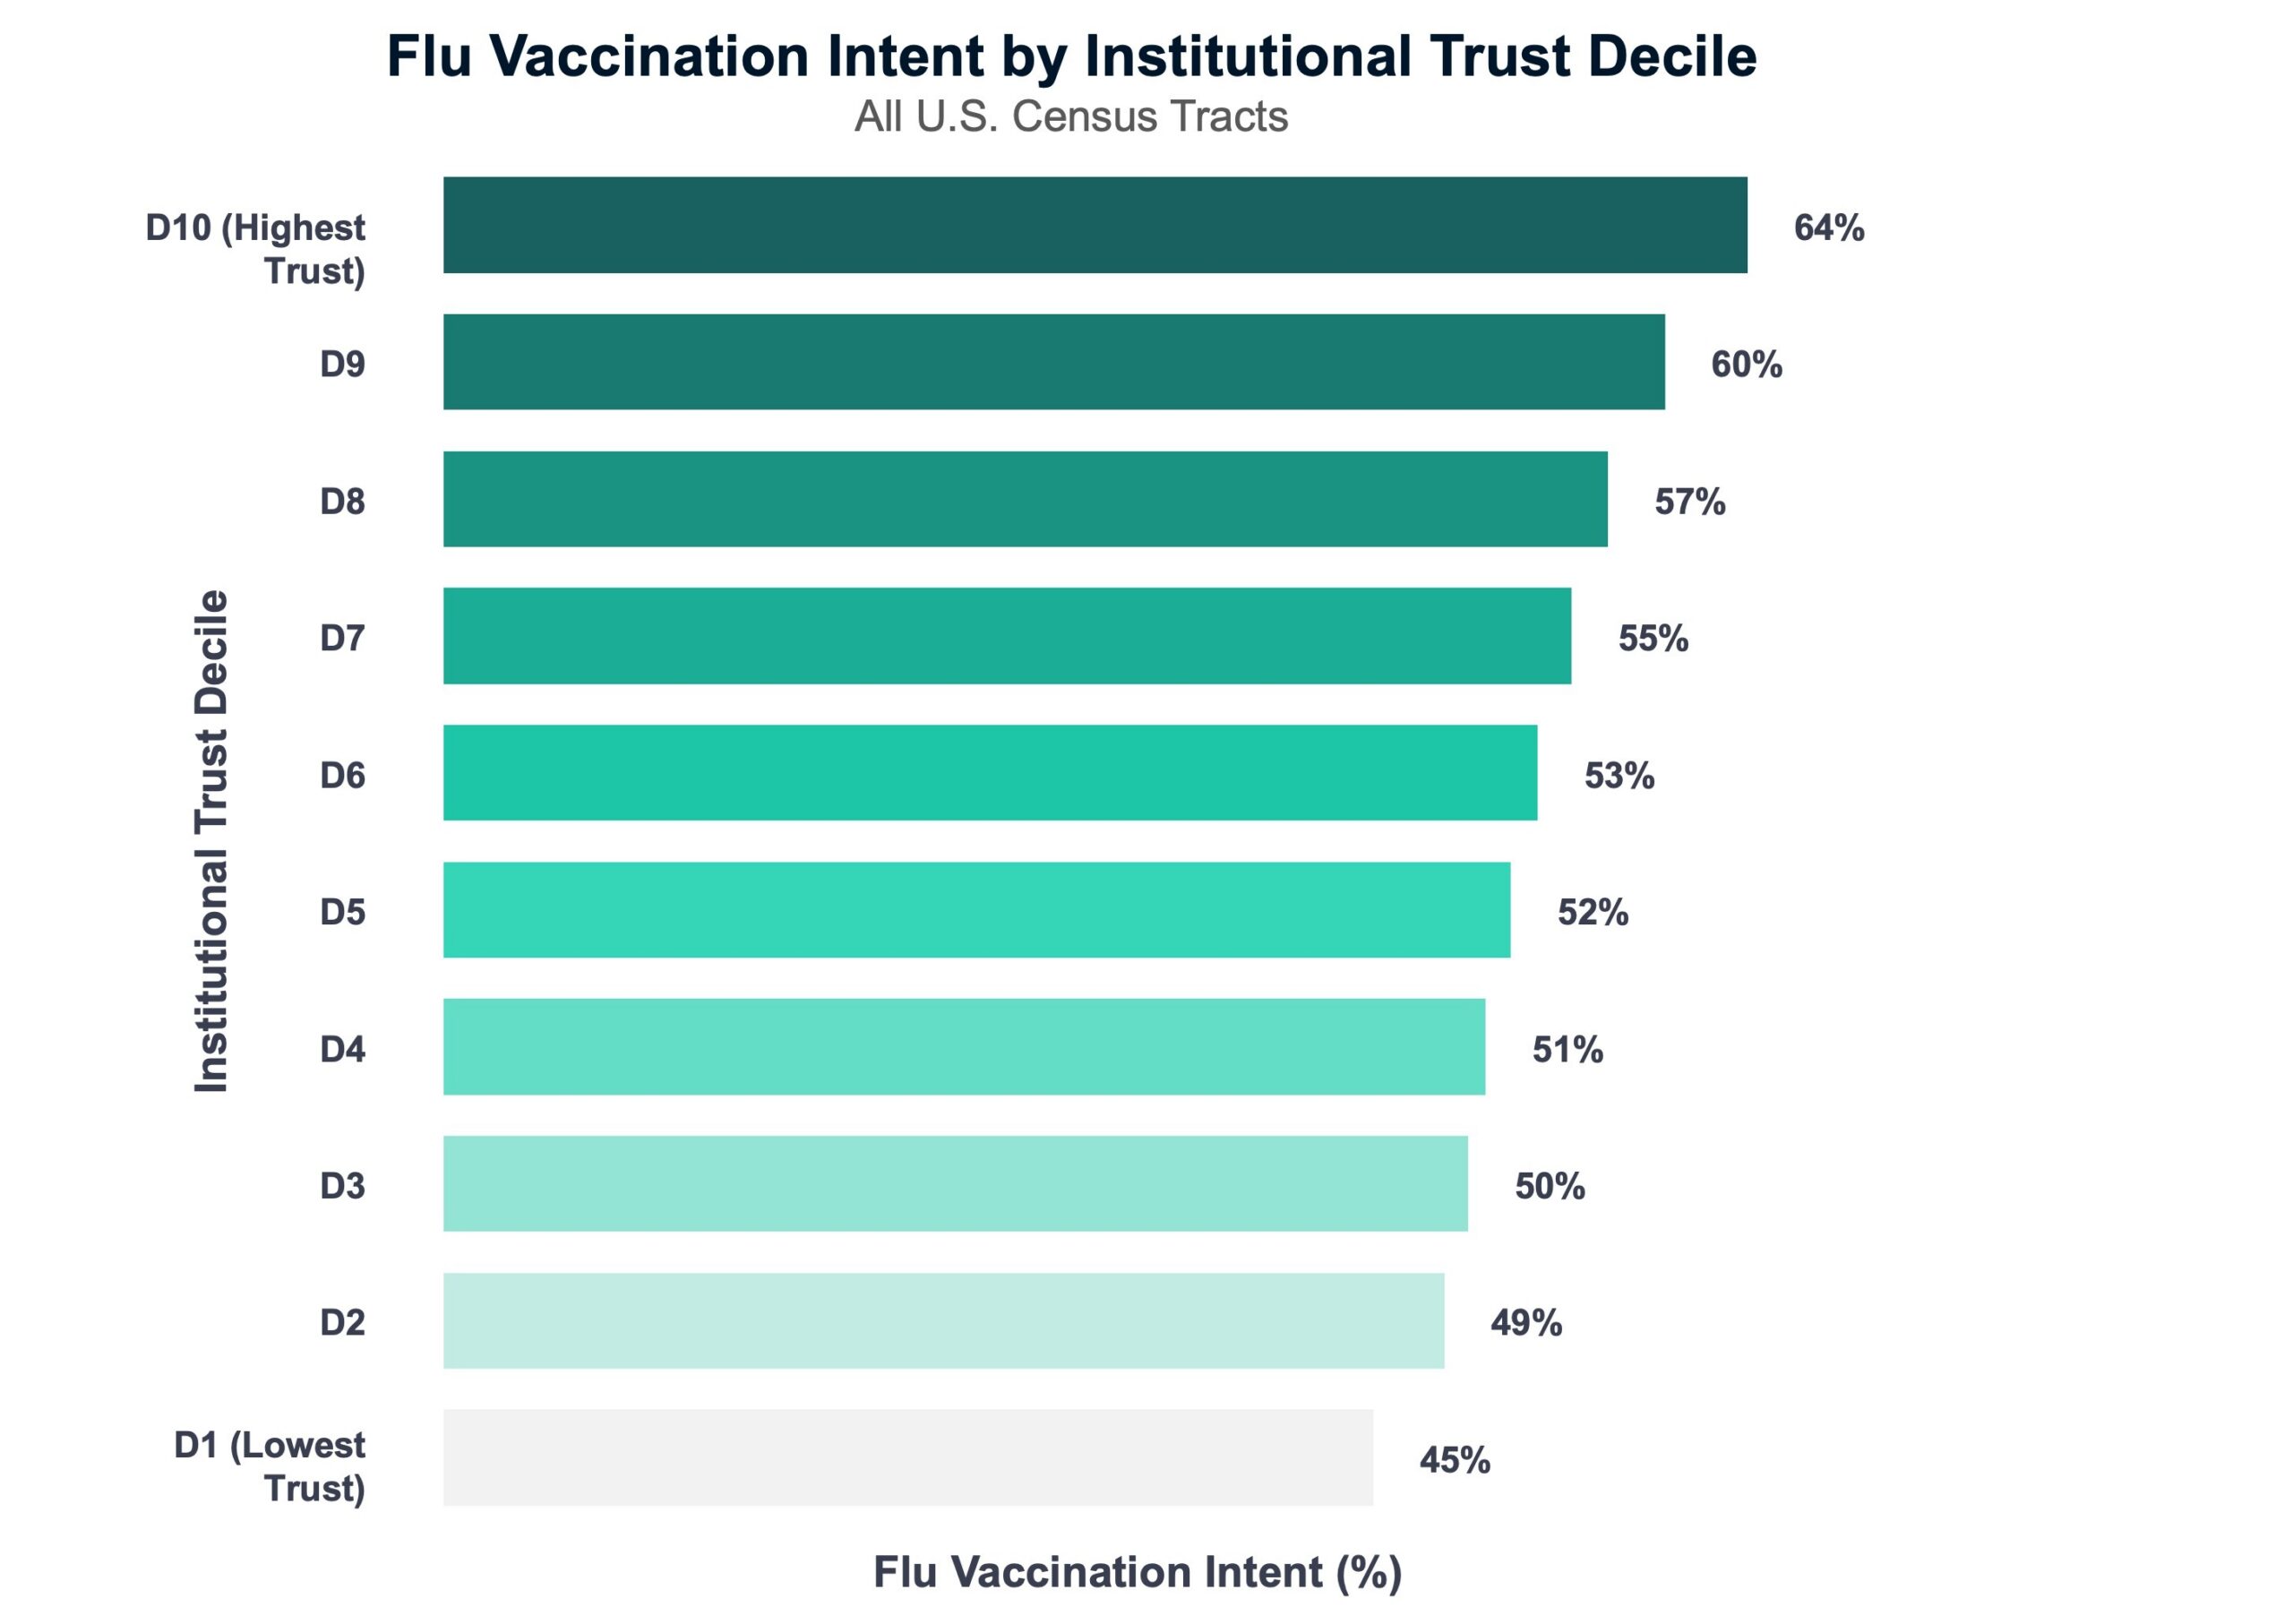
2. Trust in institutions is a powerful predictor
Trust in institutions is one of the strongest tract-level predictors of flu vaccination intent in our model — stronger than income, age, or media consumption. Tracts in the bottom decile of our institutional trust composite have an average vaccination intent of only 45%. Tracts in the top decile average 64% and reach well into the 80%+ range. A big divide, and that relationship holds after controlling for education, income, and age.
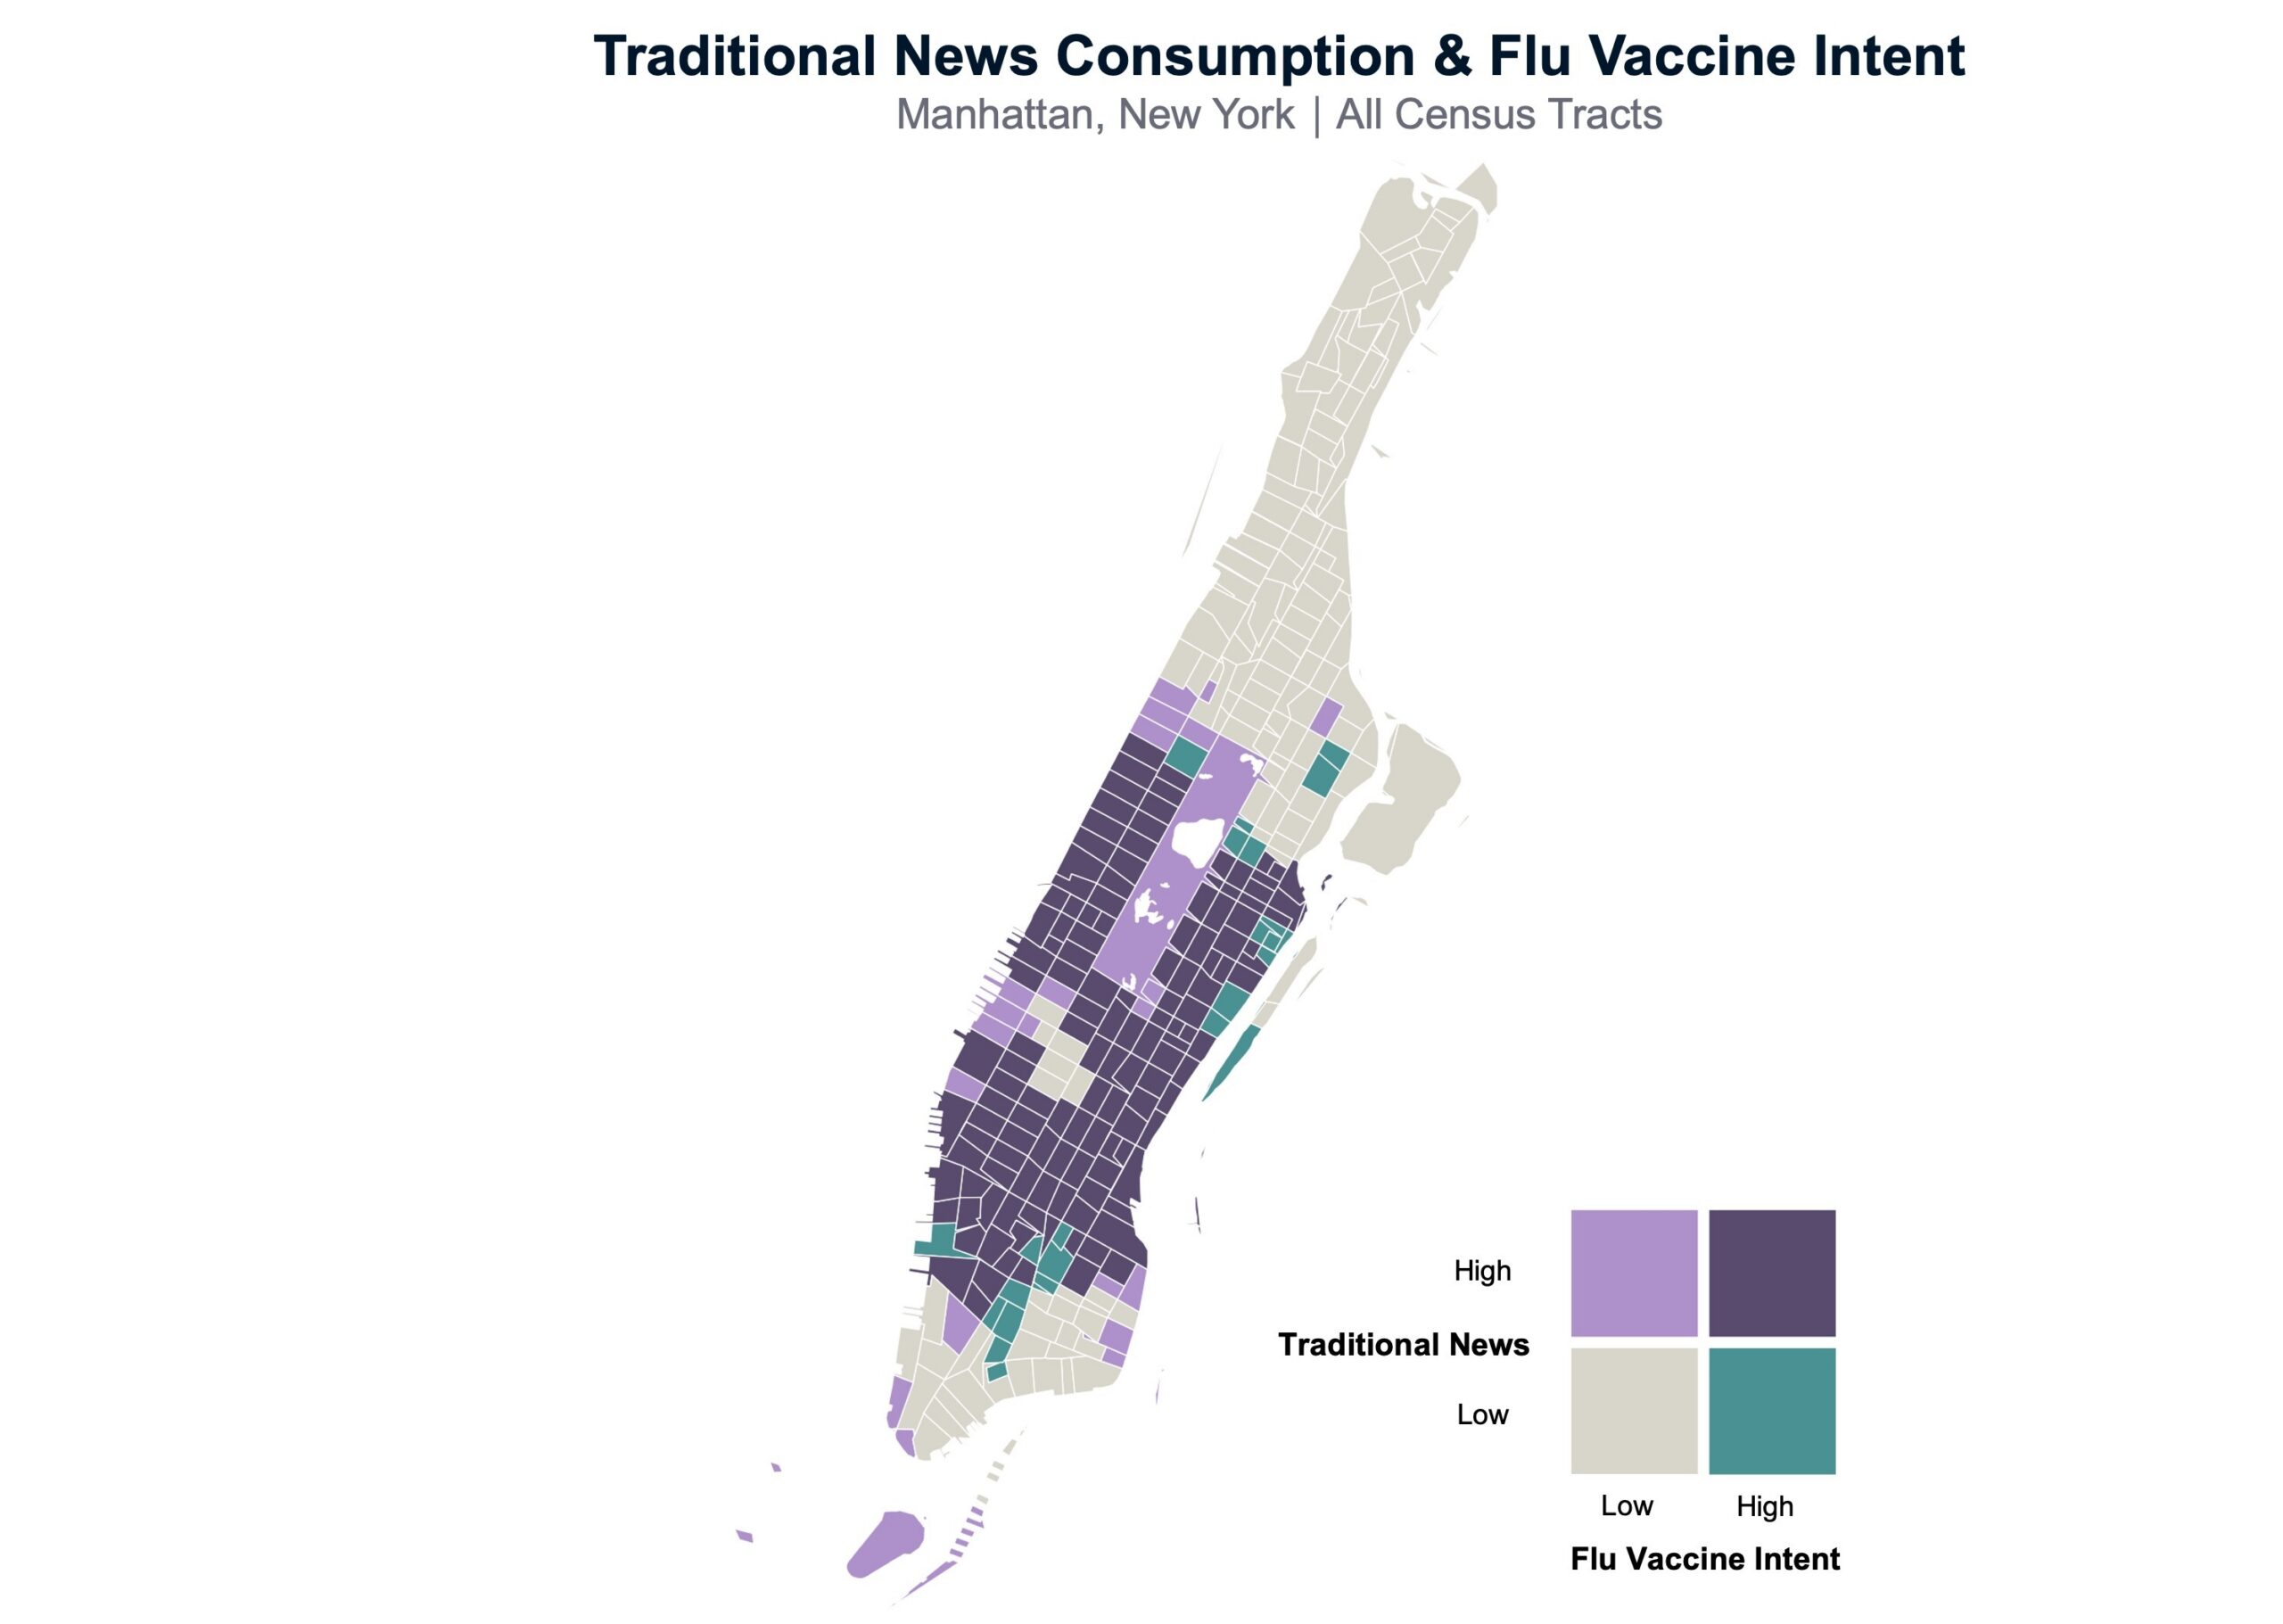
Tracts where residents rely on traditional news sources — such as AP, Reuters, the Wall Street Journal, CBS News, etc. — show substantially higher vaccination intent. Census tracts dominated by social media use (Facebook, TikTok, Snapchat) show modestly lower intent. This isn’t simply a proxy for demographics: the media effects hold after controlling for education, age, political ideology, and income. The information environment people live in shapes their health decisions, independent of who they are or their political beliefs.
For health communicators, this suggests that where a message appears may matter just as much as what it says.
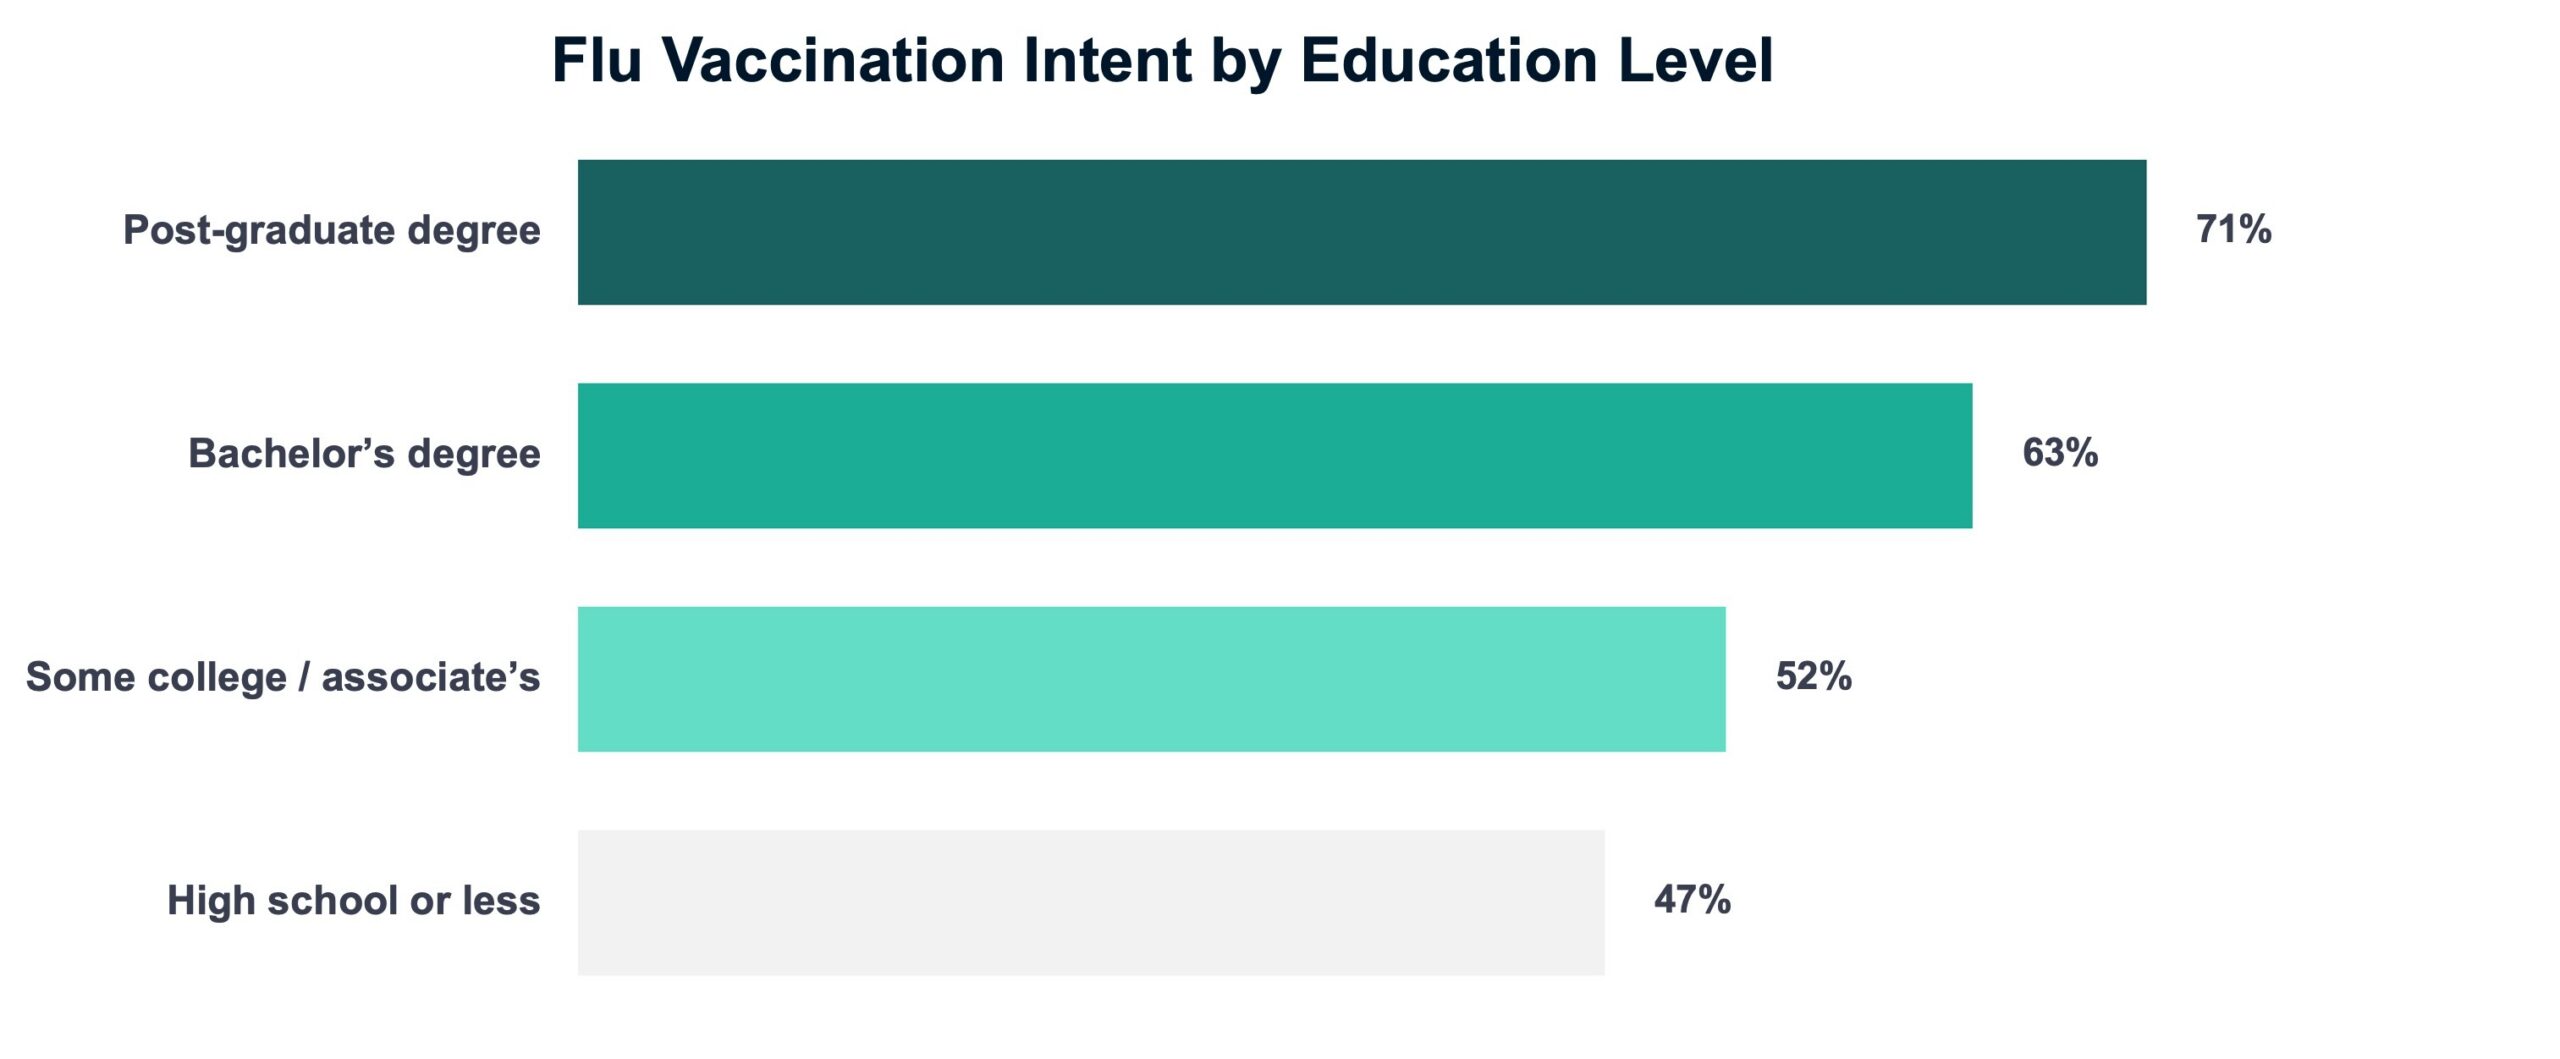
The largest demographic divide in flu vaccination intent is educational attainment. Post-graduate degree holders express positive intent at 71%, compared to 47% among those with a high school degree or less. That 24-point gap is larger than the age divide outside the 60+ cohort and far larger than the urban-rural split (just 4 points).
Communities with lower educational attainment aren’t randomly distributed — they cluster in specific geographies. Census-tract-level data can pinpoint exactly where those clusters are, enabling tailored messaging strategies that meet these communities where they are.
Among Americans who don’t plan to get a flu vaccine, 62% say none of the standard access barriers — cost, transportation, appointment availability — apply to them. Among the 60+ population, the figure rises to 70%. Only modest percentages of people cite cost or scheduling appointments as impediments. This suggests that there isn’t a systemic logistics problem.
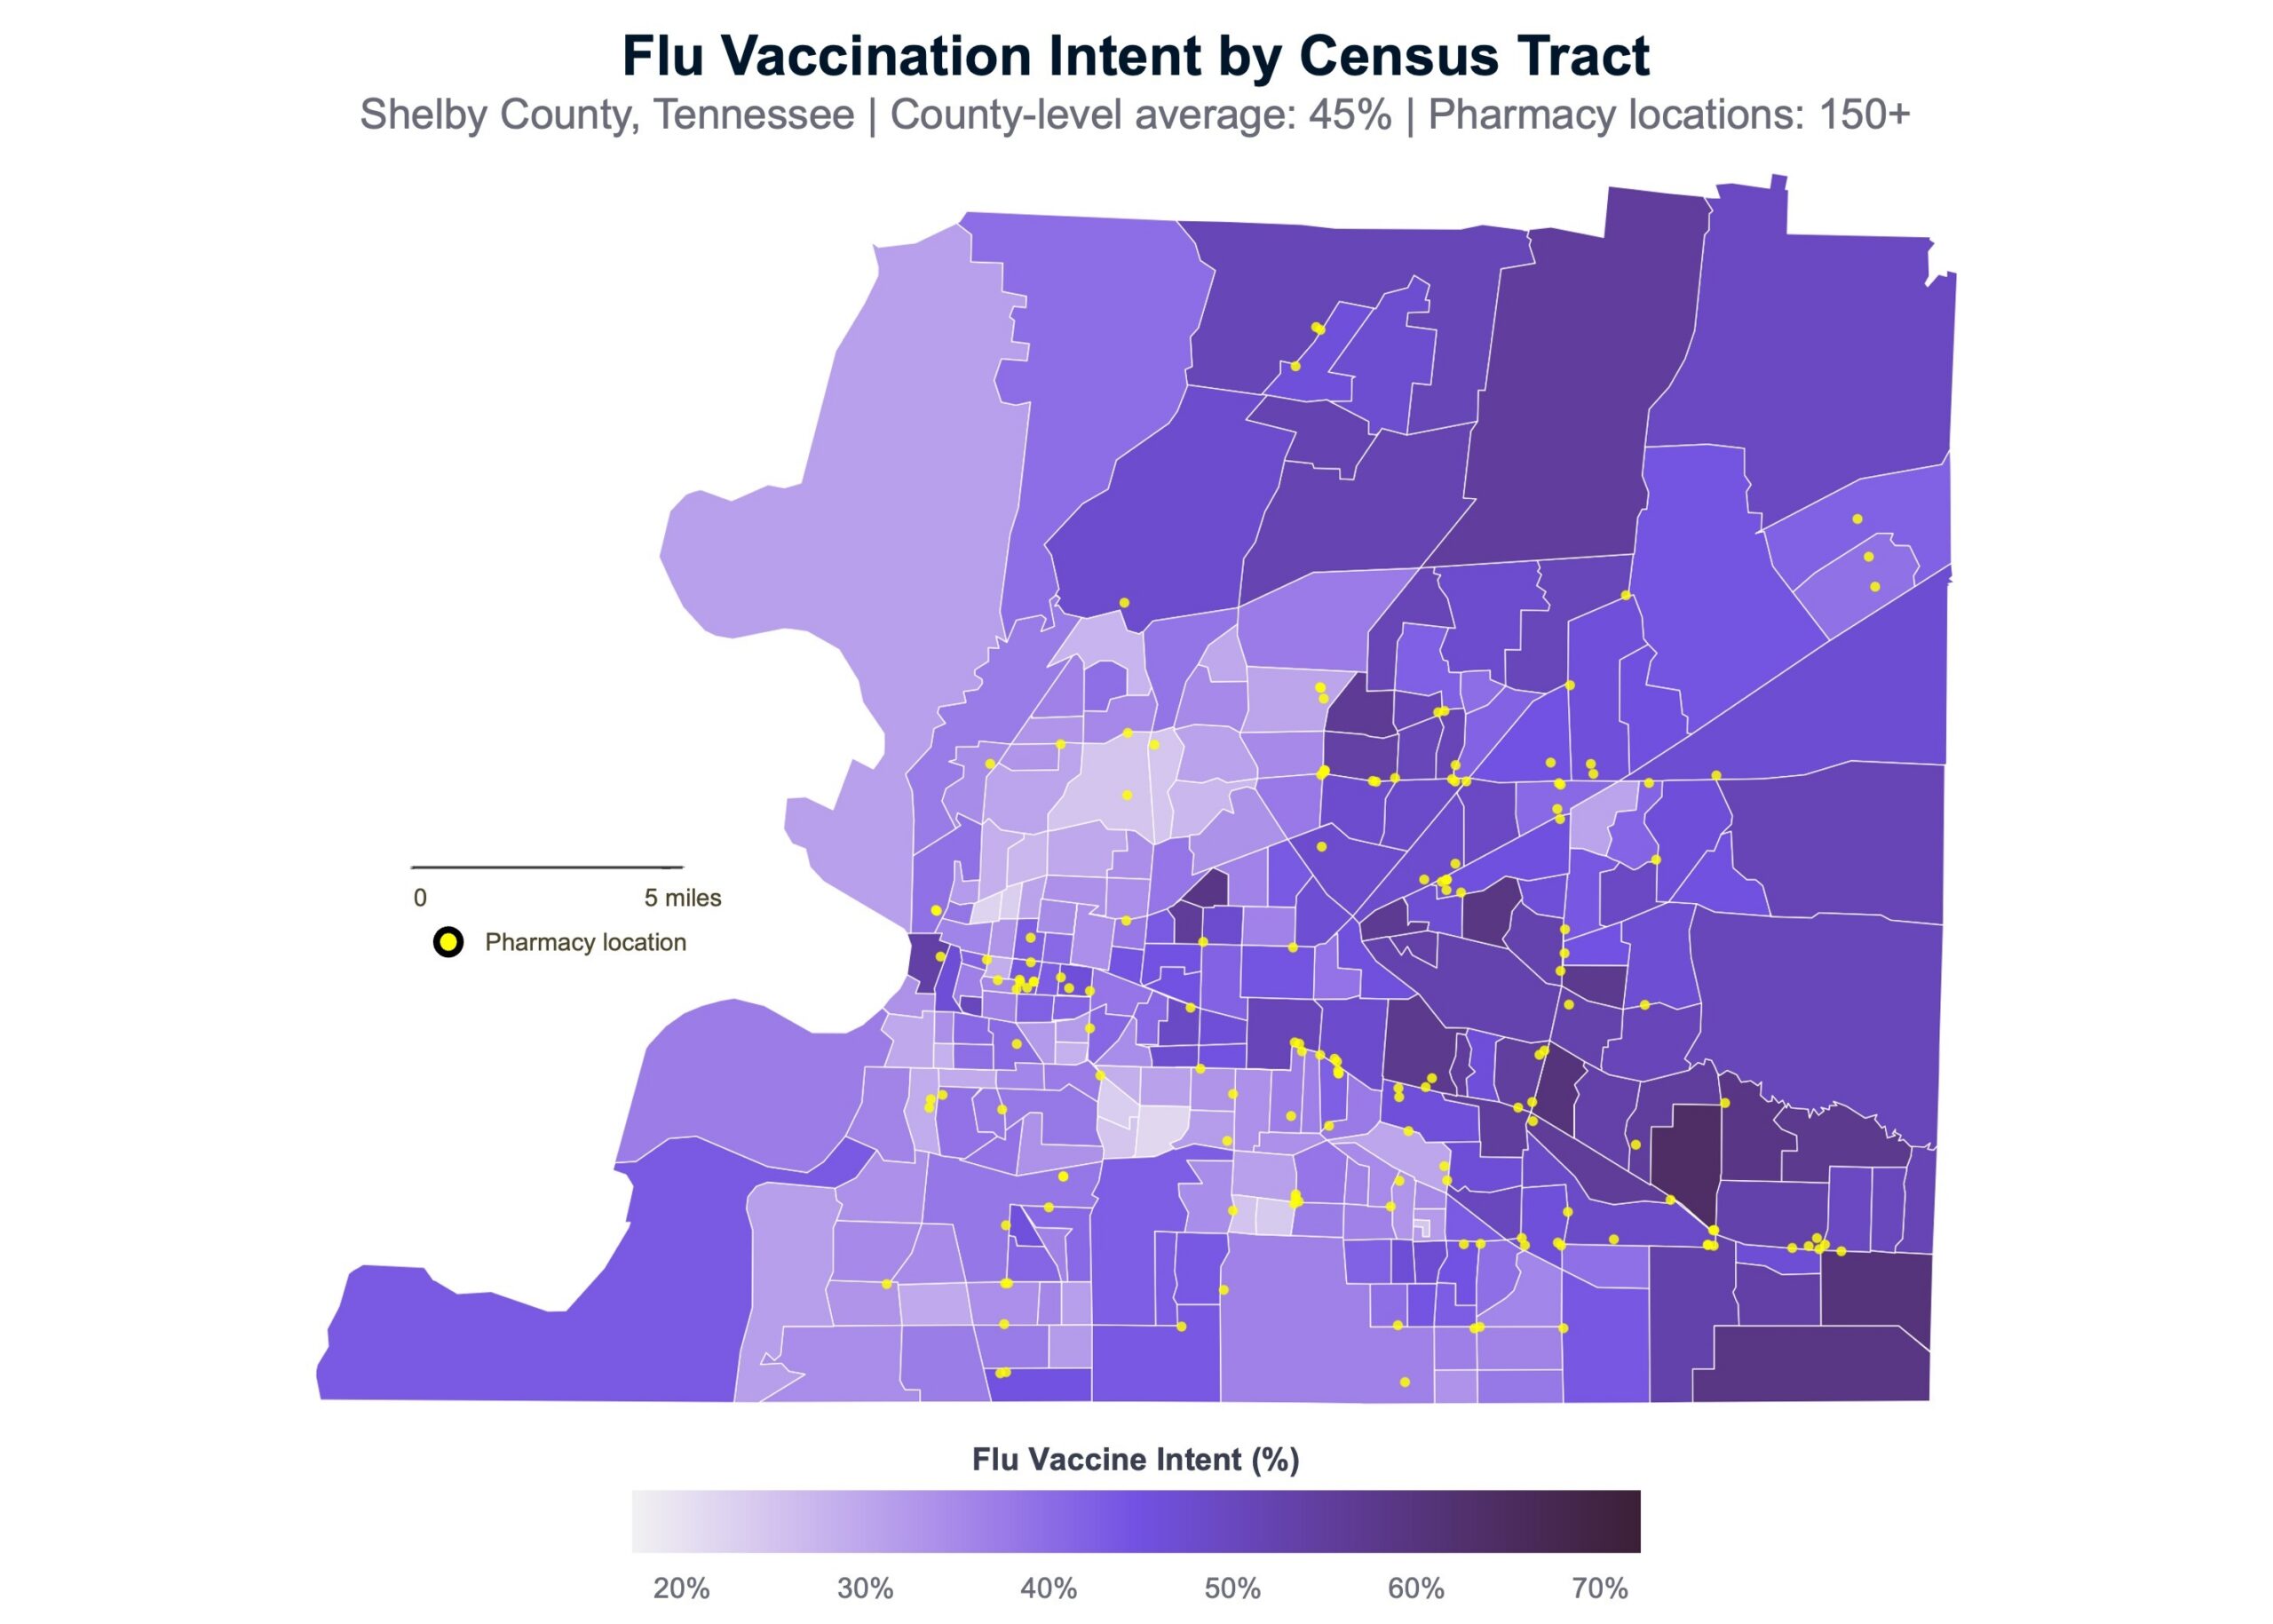
That’s not surprising, given that roughly 91% of the American population lives within 5 miles of a pharmacy that typically accepts drop-in visits. Only 1.4 percent of Americans live more than 10 miles from one. The map below of Shelby County, Tennessee (the Memphis metro area), illustrates this point. There are over 150 pharmacy locations (yellow dots). It isn’t until you move to the outlying census tracts that residents must travel more than a mile or two to reach a pharmacy.
Our model actually finds that tracts reporting more access barriers show higher vaccination intent — the opposite of what you’d expect if barriers were the constraint. The likely explanation: people who report barriers are those actively trying to get vaccinated and encountering friction.
The biggest leap to reaching the longstanding 70% flu vaccine coverage rate probably isn’t removing barriers for the willing. That will help, but it won’t get us to the bigger goal. It’s reaching the people who aren’t engaging with the healthcare system at all. Especially those with less education, lower trust in institutions, and a heavy reliance on social media for their news. That will be the focus of another analysis soon, so keep an eye out.
Fraym tracks flu vaccination intent, plus hundreds of other issues, each month across 84,000+ US census tracts. For more information about hyperlocal vaccination-related data and public campaign targeting, contact us at [email protected].

