Americans increasingly live in very different information worlds. Not just different opinions — different facts. And the communities most susceptible to misleading information aren’t random. They follow measurable, mappable, and actionable patterns.
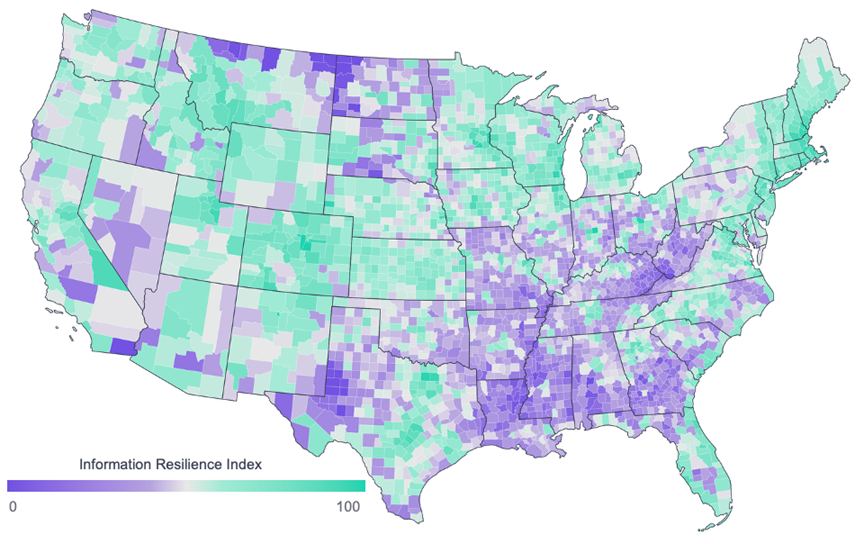
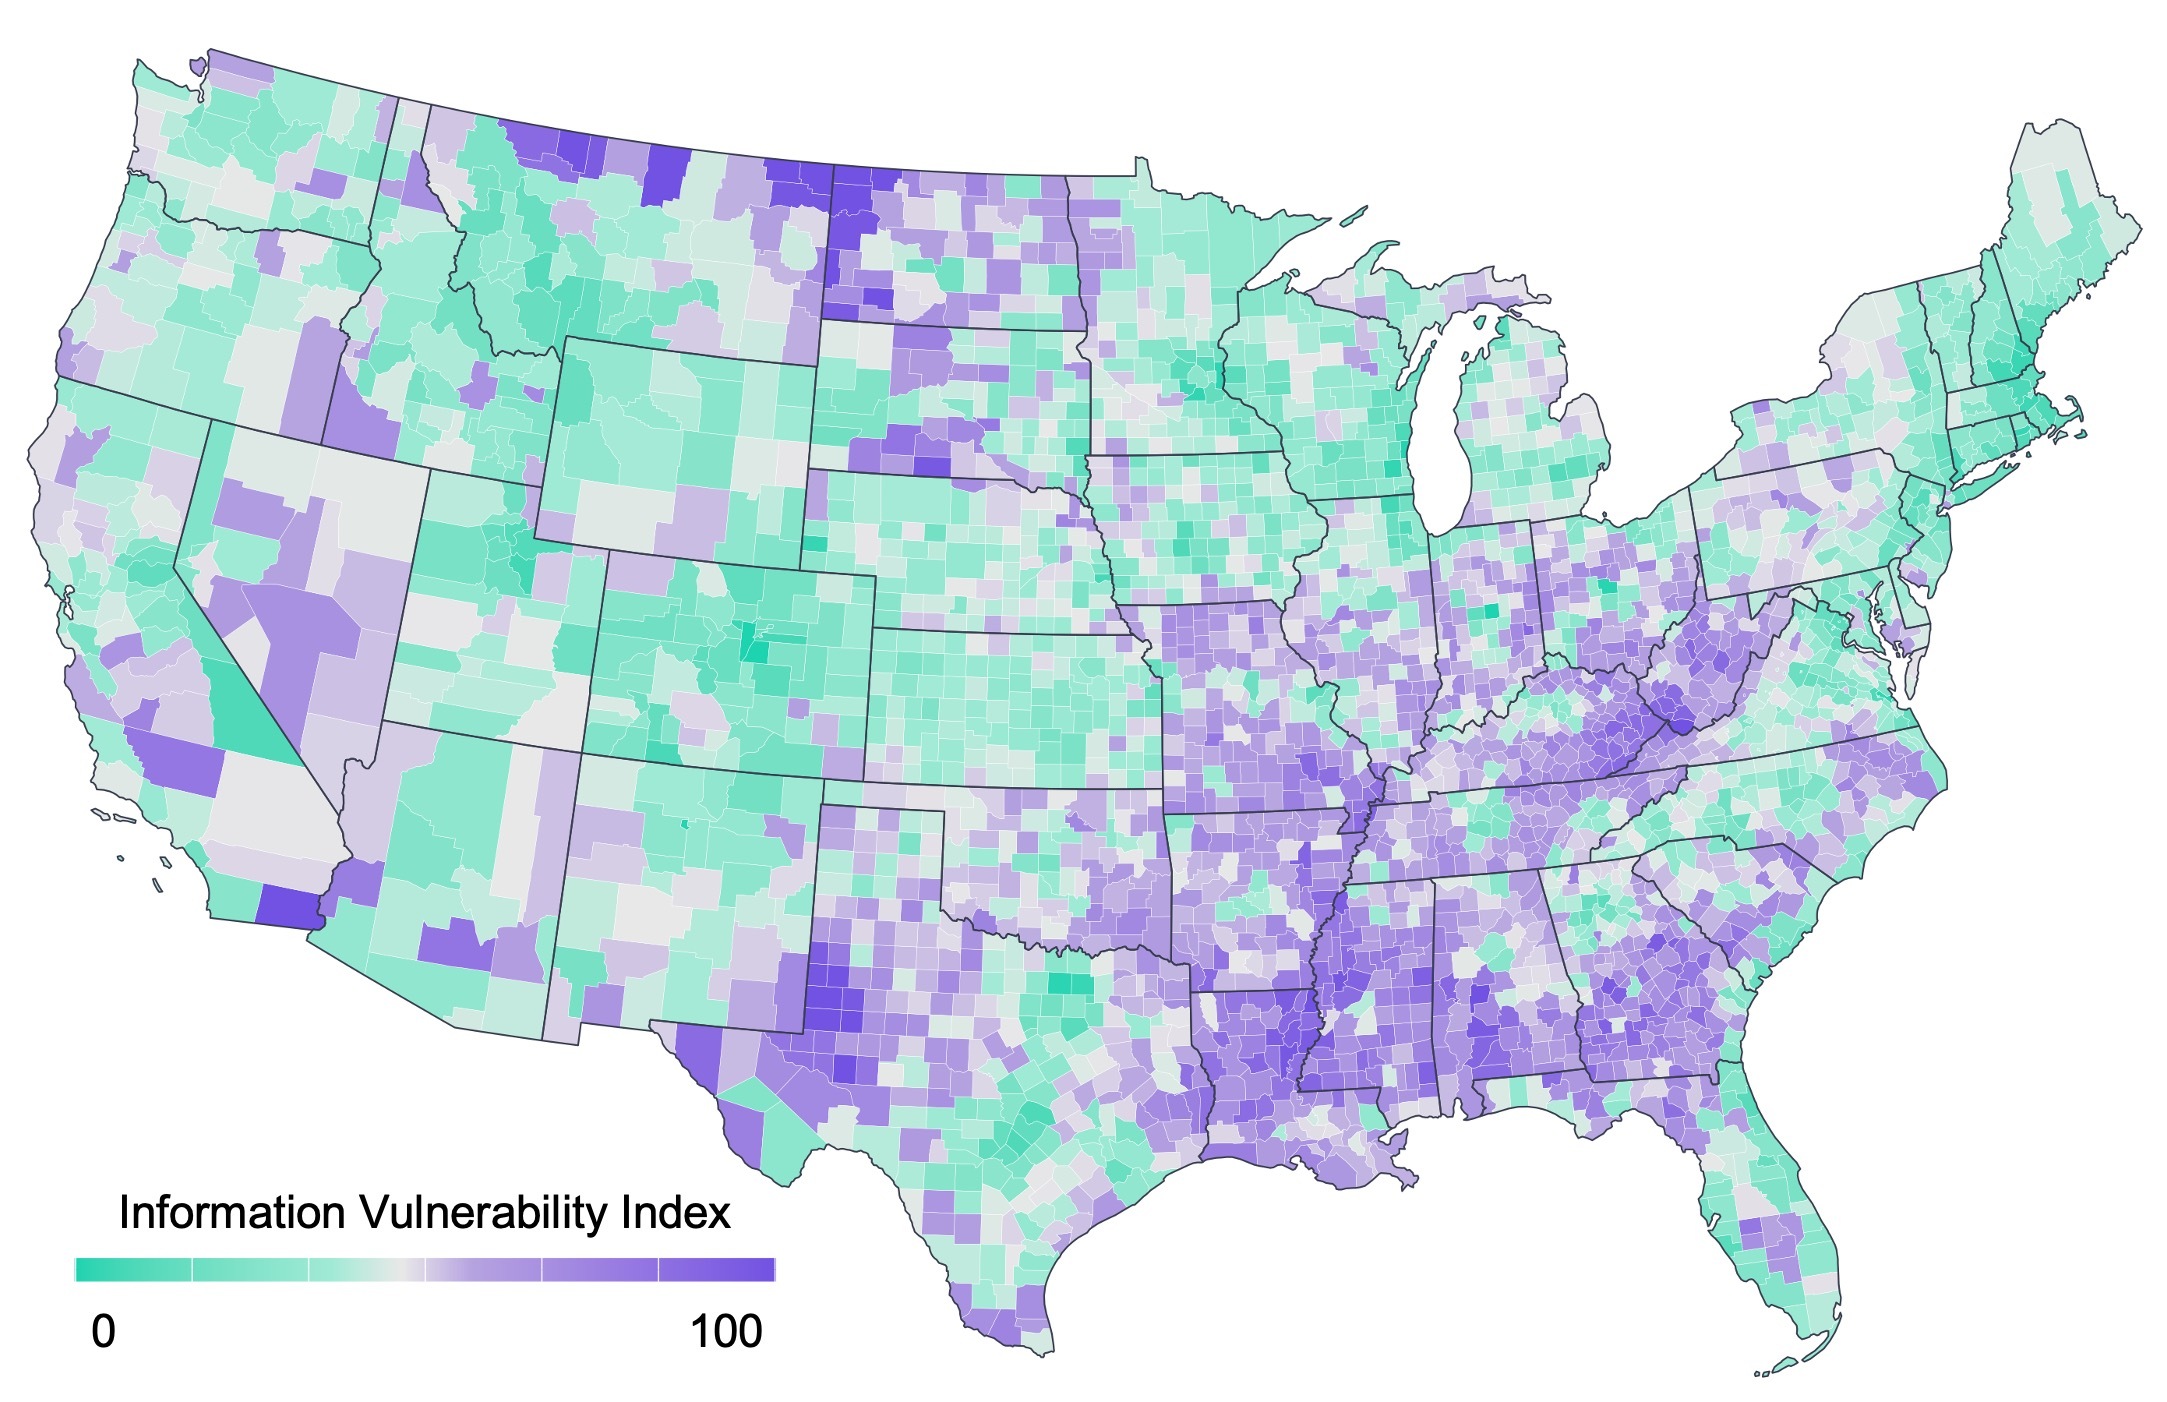
That’s why Fraym built the Information Vulnerability Index — a first-of-its-kind tool that quantifies U.S. communities’ vulnerability to false and misleading information, down to the 1km2 level.
Most conversations about digital deception focus on the supply side: who’s creating it, which platforms amplify it, and how to take it down. Those discussions matter. But it misses a fundamental question: why do some communities absorb and then spread false information more readily than others?
The answer lies in a combination of structural and behavioral factors — education levels, economic stress, media habits, social trust, and political isolation — that vary enormously from one neighborhood to the next. A booming tech hub and an agricultural county in the Midwest may sit in the same country but occupy entirely different information environments. One may have strong local journalism, high digital literacy, and diverse social networks. The other may have none of these.
Understanding this demand side — who is most susceptible and why — is the missing piece in building real resilience.
Information vulnerability is intensely spatial. A single congressional district can contain communities that warrant completely different interventions. One ZIP code might struggle with low digital literacy among older residents. The next might have high social media dependence among younger demographics. Across town, economic disenfranchisement and deep institutional distrust could be the dominant drivers.
National averages hide these differences entirely. And interventions designed for “the country” or an entire state will inevitably miss the communities that need them most. Effective responses require the kind of granular, place-based intelligence that has been largely unavailable — until now.
How We Built the Information Vulnerability Index
Fraym developed the Information Vulnerability Index through a rigorous, research-grounded process. We started with a cross-disciplinary literature review spanning more than 30 academic studies in psychology, political science, public health, information science, and communications. We also reviewed every major publicly available index in this space.
From that foundation, we identified five pillars of information vulnerability:
Digital literacy — education levels and age-related gaps in information processing
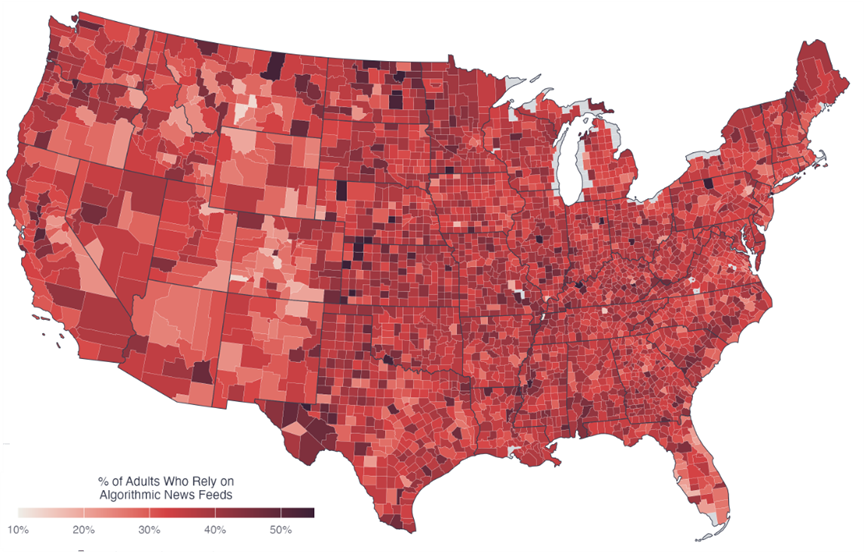
Social media habits — reliance on social platforms for news, trust in algorithmic curation, and passive consumption patterns
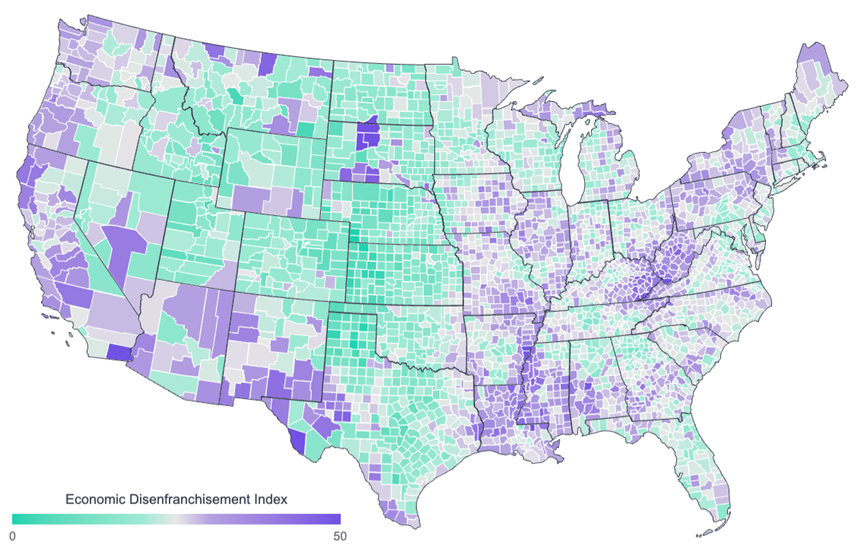
Economic disenfranchisement — poverty, unemployment, and a self-perceived lack of economic agency, which can foster grievance and mistrust that misleading narratives exploit
Political polarization — ideological homogeneity, absence of cross-partisan relationships, and hostility toward opposing views, which limits exposure to corrective information and reinforces echo chambers
Community disengagement — weak local ties, low institutional trust, and shallow social connections that reduce the social norms and efficacy of trusted voices
We then produced custom hyper-local data spanning hundreds of indicators down to the 1km2 level, and used Principal Component Analysis to identify which indicators best explained each dimension of information vulnerability — retaining only those with both statistical strength and academic grounding. Indicators were then standardized, weighted transparently, and scaled against fixed benchmarks so that information vulnerability index results remain comparable across time and geography.
The result is a composite score for every state, congressional district, county, and even census tract in the country. Each score can be decomposed into its five pillars, revealing not just where information vulnerability is highest (or lowest) but why. For instance, as you will see below, clear geographic patterns of economic disenfranchisement become immediately visible at the county level.
Economic Disenfranchisement Sub-Index, County Level
We finally validated the index against real-world data, confirming that higher scores strongly correlate with greater acceptance of known false narratives. And these relationships hold across the political spectrum.
From Diagnosis to Action
Data is only useful if it changes decisions. The Information Vulnerability Index is designed to do exactly that.
For public education and engagement programs, the index helps identify where to invest and what type of programming to deploy. A community with high levels of digital illiteracy may need skills training. One driven by poor social media habits may benefit more from accuracy prompts or media literacy campaigns. The sub-index structure makes these distinctions actionable at the local level.
For campaigns and outreach, the index helps organizations target resources precisely — reaching the communities where resilience-building efforts will have the greatest impact, rather than spreading investments thinly across entire states or regions.
For researchers, the index provides a validated, high-resolution baseline for studying how information environments evolve, evaluating the effectiveness of interventions, and identifying emerging vulnerabilities before they become crises.
The fight against digital deception has focused heavily on content moderation and platform regulation. Those discussions matter. But lasting resilience is built community by community — and it starts with understanding what makes each one vulnerable. That’s what the Information Vulnerability Index delivers.
Fraym maps human characteristics at unprecedented resolution to power smarter decisions. To learn more about the Information Vulnerability Index or explore partnership opportunities, contact Melissa Persaud at [email protected].
We use cookies to ensure that we give you the best experience on our website. If you continue to use this site we will assume that you are happy with it.