Case Studies
Build Effective Social and Behavior Change Strategies
")
Read More
Using advanced geospatial data and analytics, we can now understand population characteristics at the neighborhood level in regions where data has been traditionally hard to access. From socioeconomics, to healthcare and electricity access, we can precisely describe the people in specific countries, cities, and regions based on over 60 indicators. The availability of this insight vastly improves beneficiary targeting, and has implications for the strategy, planning, and implementation of large-scale projects.
Here, we explore vaccination coverage in the Sahel over the last decade.
As a Global Vaccine Alliance, Gavi works to create access to vaccines for children in some of the world’s poorest countries. In partnership, we set out to measure vaccination outcomes over time, and investigated key challenges to reaching under-vaccinated children.
To determine who is being left out and where, we looked at where children under 5 have received important vaccinations, and where they haven’t–illustrating areas with high concentrations of underserved children. Next, we dug deeper to understand the spatial factors that might affect vaccination coverage, like infrastructure, instability, and urbanization.
In both Chad and Mali, conflict is challenging the Alliance efforts to strengthen health systems and reach underimmunized children. An estimated 600,000 underimmunized children, representing around 15% of those missing out on childhood vaccines in the two countries, live in conflict areas.
Despite this, the overall vaccination coverage around conflict areas is comparable to the non-conflict areas, thanks to government and Gavi support. However, this is largely because most conflict events take place in urban areas, where vaccination rates are historically higher than in sparsely populated rural communities. – Gavi
Additionally, time series mapping illustrated trends to help capitalize on past successes and learn from challenges.

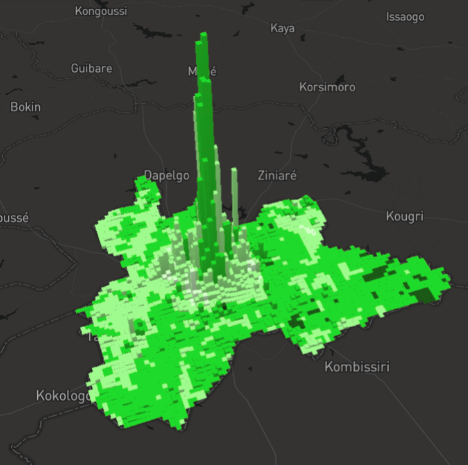
The 3D images above show the children’s population and DPT3 vaccination rate a decade ago and today for 1km by 1km grids across Ouagadougou, Burkina Faso. Taller bars correspond to areas with a greater number of children, while darker shades of green denote areas that have a higher proportion of vaccinated children. A decade ago, at least 1 in 4 children was under-vaccinated in most neighborhoods of the city. 10 years later, the city saw massive population growth in terms of the number of children per square kilometer, particularly toward the city center. Despite this population growth, many neighborhoods maintained or improved vaccination coverage.
These maps provide a visually striking example of how Gavi partners can target their efforts to vaccinate more children. Moving beyond gut feeling and high level statistics, Fraym provides actionable intelligence about which neighborhoods and which streets have the most under-vaccinated children. With this insight, Gavi partners can more efficiently deploy their resources to reach these children and bring life-saving vaccines.

